
Exploring Musical Tastes
A data analysis of my Spotify music collection: artist variety, genre distribution, song lengths, and more.
Tools: Python (pandas, matplotlib), Exportify

A data analysis of my Spotify music collection: artist variety, genre distribution, song lengths, and more.
Tools: Python (pandas, matplotlib), Exportify
Music has always been a big part of my life. Besides playing it, I spend a fair amount of time listening to it — around 45,000 minutes a year — that's ~14% of my waking hours! And when people ask you "What music are you into?", I find that's a hard question to answer. Sure, I could list off a few of my favorite bands or genres, but there are so many other things that go into it — songs don't necessarily fall into a single genre or category, and your preferences depend on your mood, environment, and they change over time. So I decided to start this project as an attempt to quantify some of my musical tastes and, at the very least, satisfy some of my curiosities!
This project started with Exportify — a great website where you can download your Spotify playlists in CSV format. From there, I coded a Python script to parse the data from my "Liked Songs" playlist — the largest playlist I have, containing all of the songs in my library (11,295). I then used pandas and matplotlib to output plots that analyzed various aspects such as artist/genre distributions, song release dates, or musical properties.
Definitely! If you're curious about your own musical taste and you use a Spotify account, follow these steps below to analyze your musical data:

spotify_analysis_online.py into a folder and put your CSV in the same folder.
spotify_analysis_online.py in your favorite Python IDE, I like Spyder or VS Code.
If you run into any problems, please contact me and I'll
try my best to fix the issue.
Additionally, if you have ideas for other things to analyze, I'm all ears!
I began by analyzing the distribution of artists in my playlist to see who appears most frequently. This is similar to what Spotify does with Spotify Wrapped each year. However, I decided to plot to top 30 artists in my library, ranked by the number of their songs that I have liked.
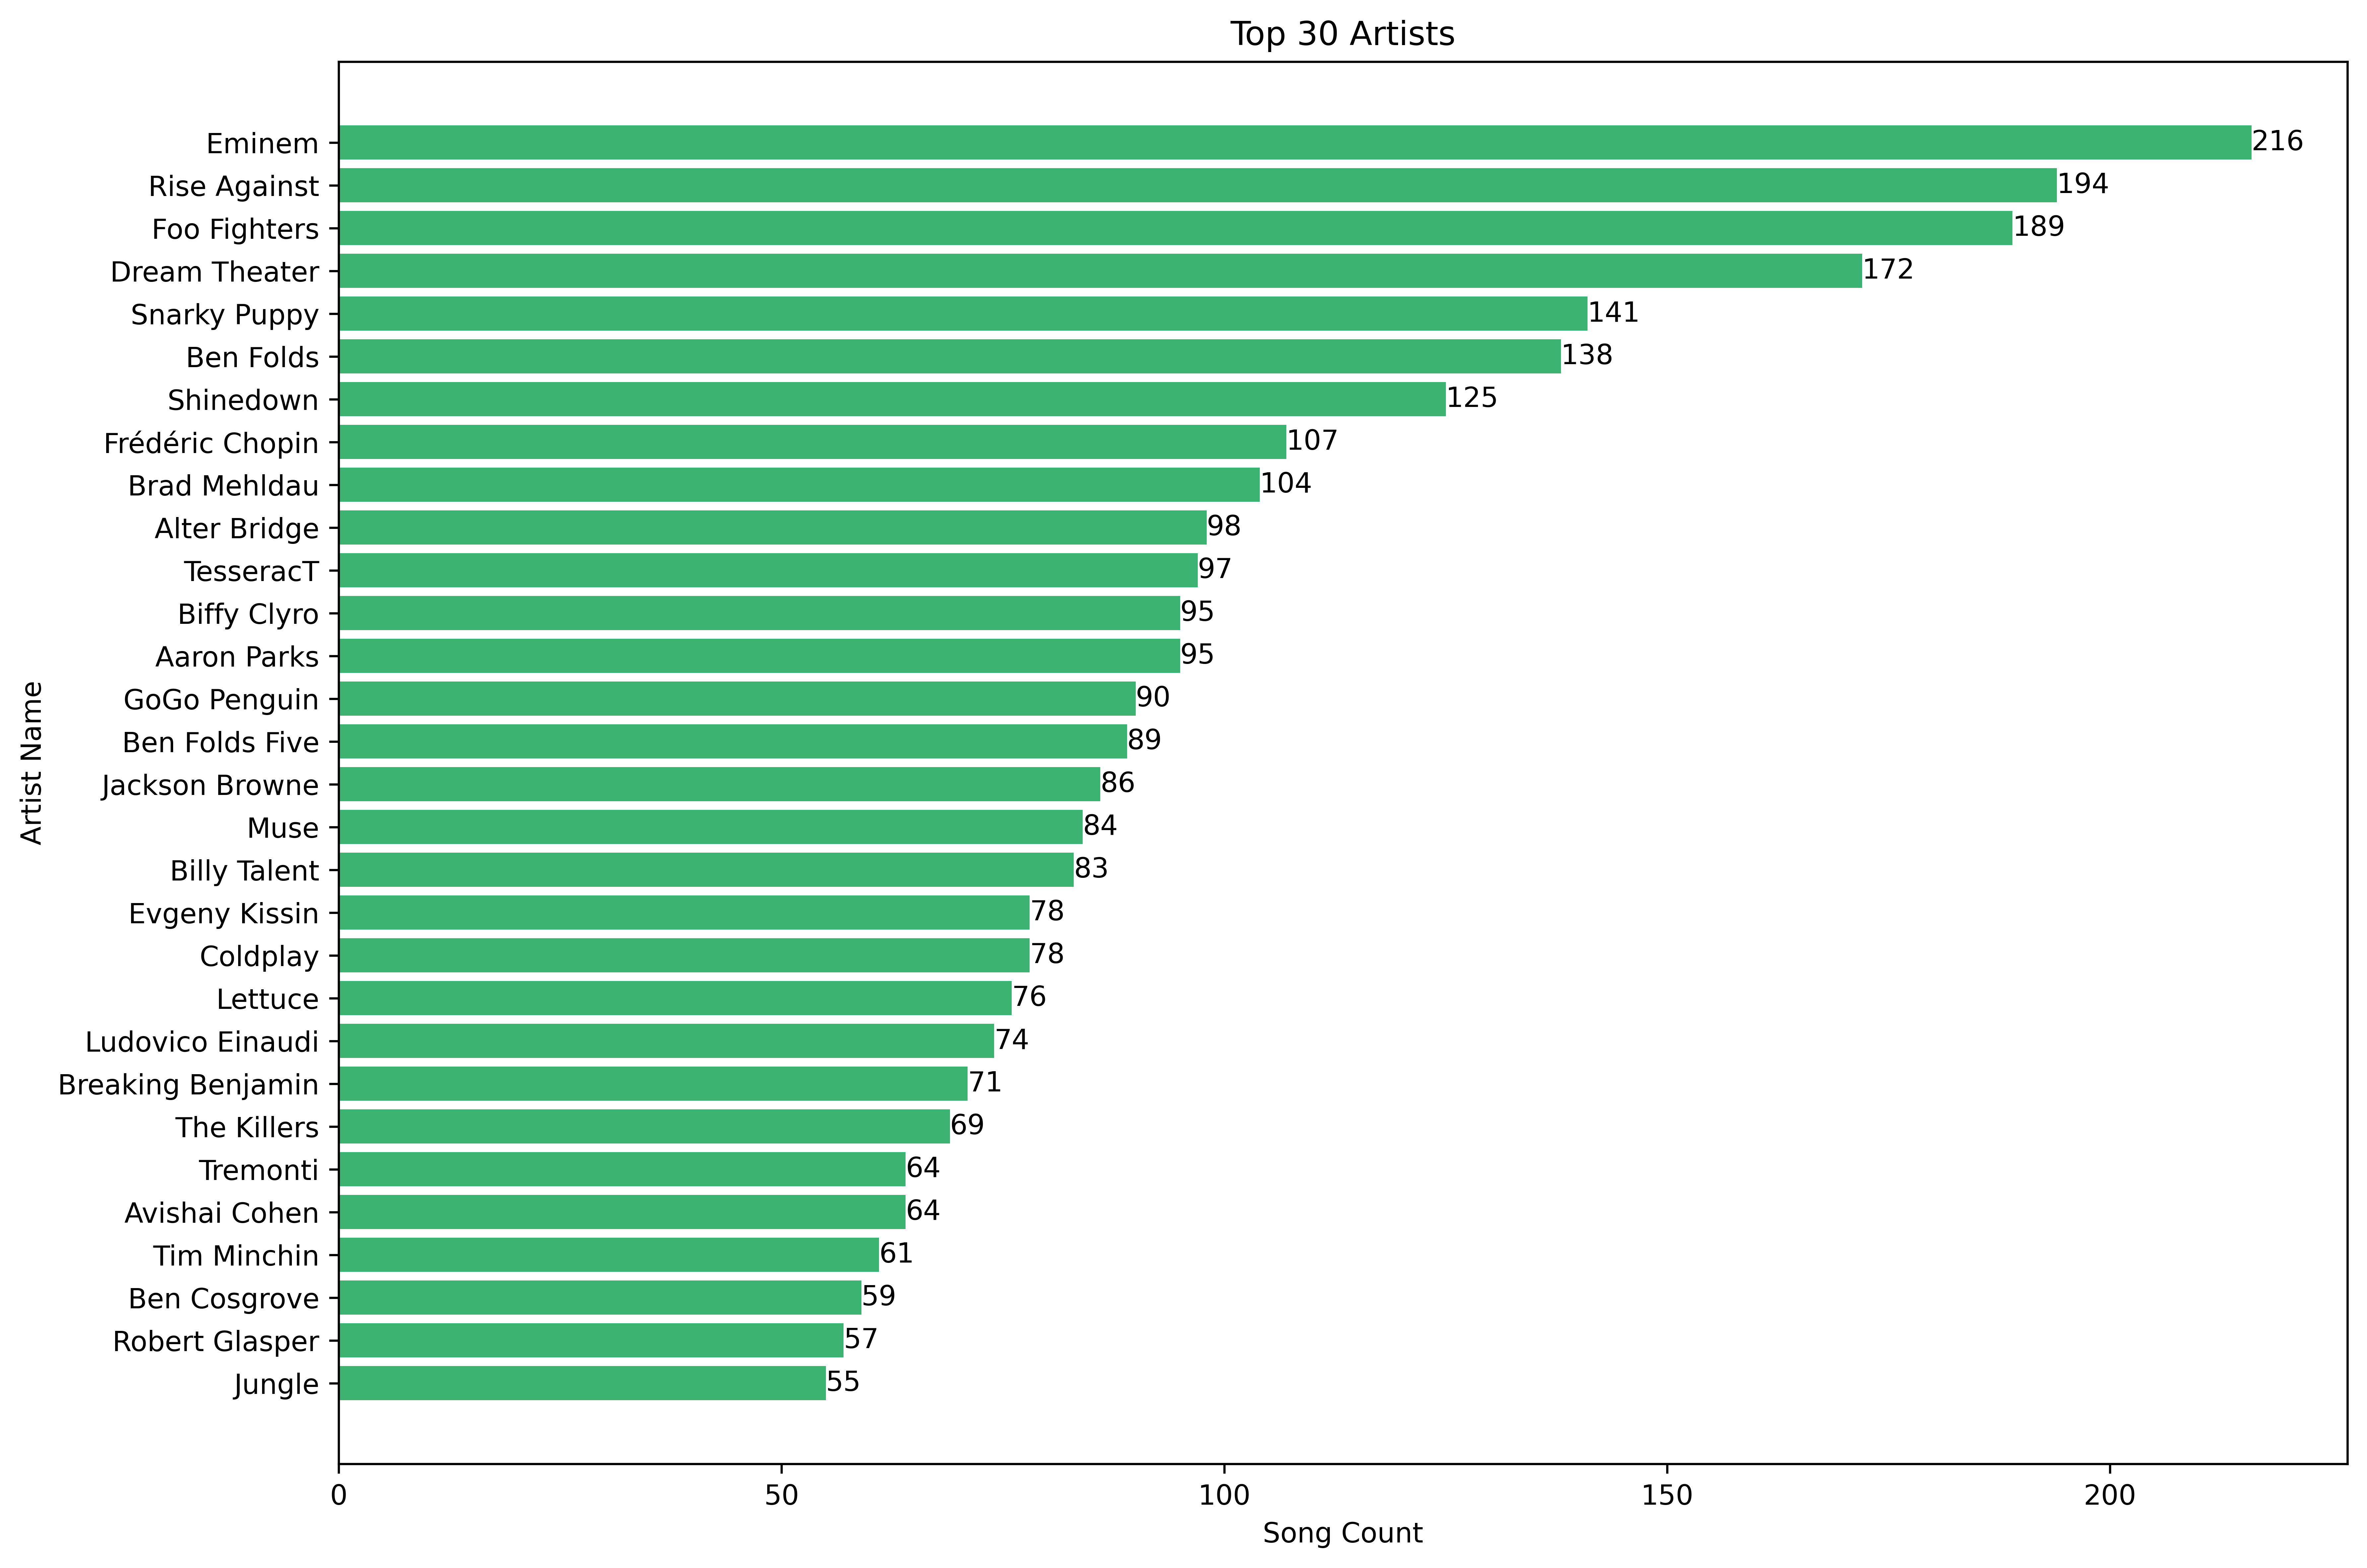
Since this is data for the entire time I have been using Spotify (13 years), it includes songs I liked back when I was a teenager (mostly the Eminem). I decided to analyze another one of my playlists called "Current Favorites" to see if my favorite artists have changed much over time. I started that playlist 7 years ago, and keep it updated based on my current taste, meaning I also remove songs when I'm no longer a huge fan. Let's see how it compares.
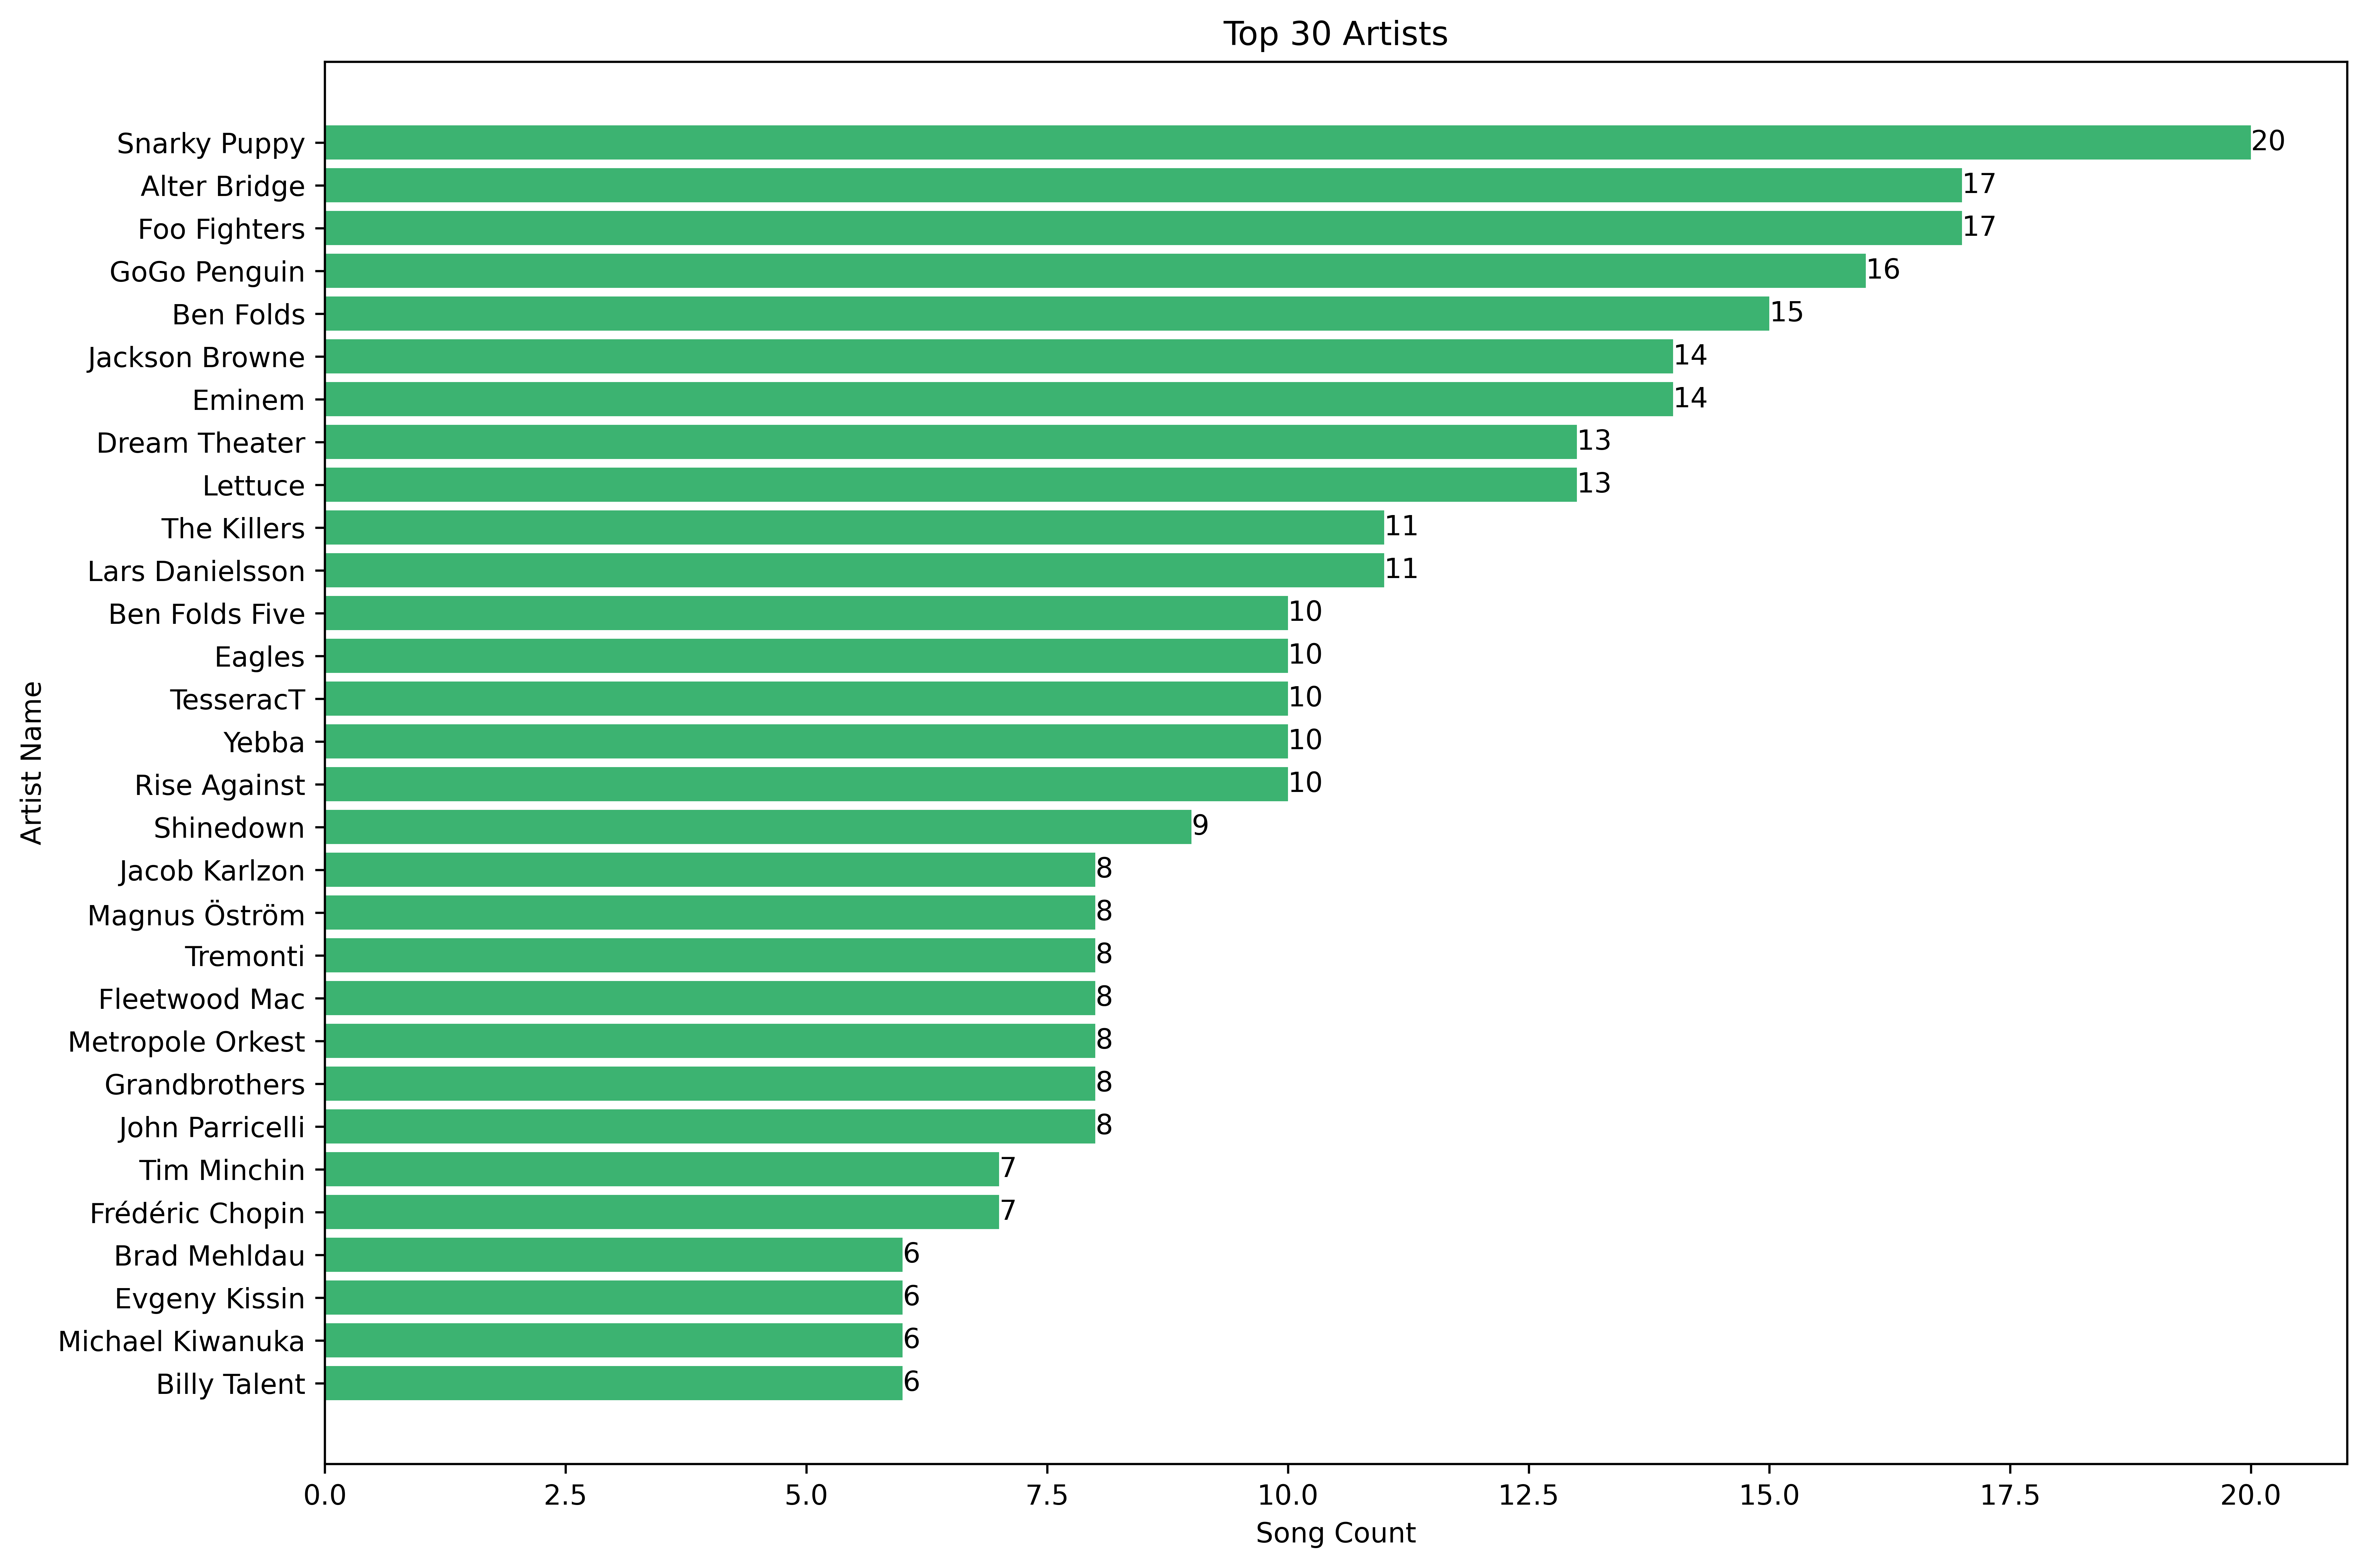
This looks like a better representation of my favorite bands at the moment!
Next, I tried breaking down the different genres represented in my playlist and identifying the most common ones. Spotify tags each song with a number of different genres, and each song can have multiple genres assigned. What genres do I listen to?
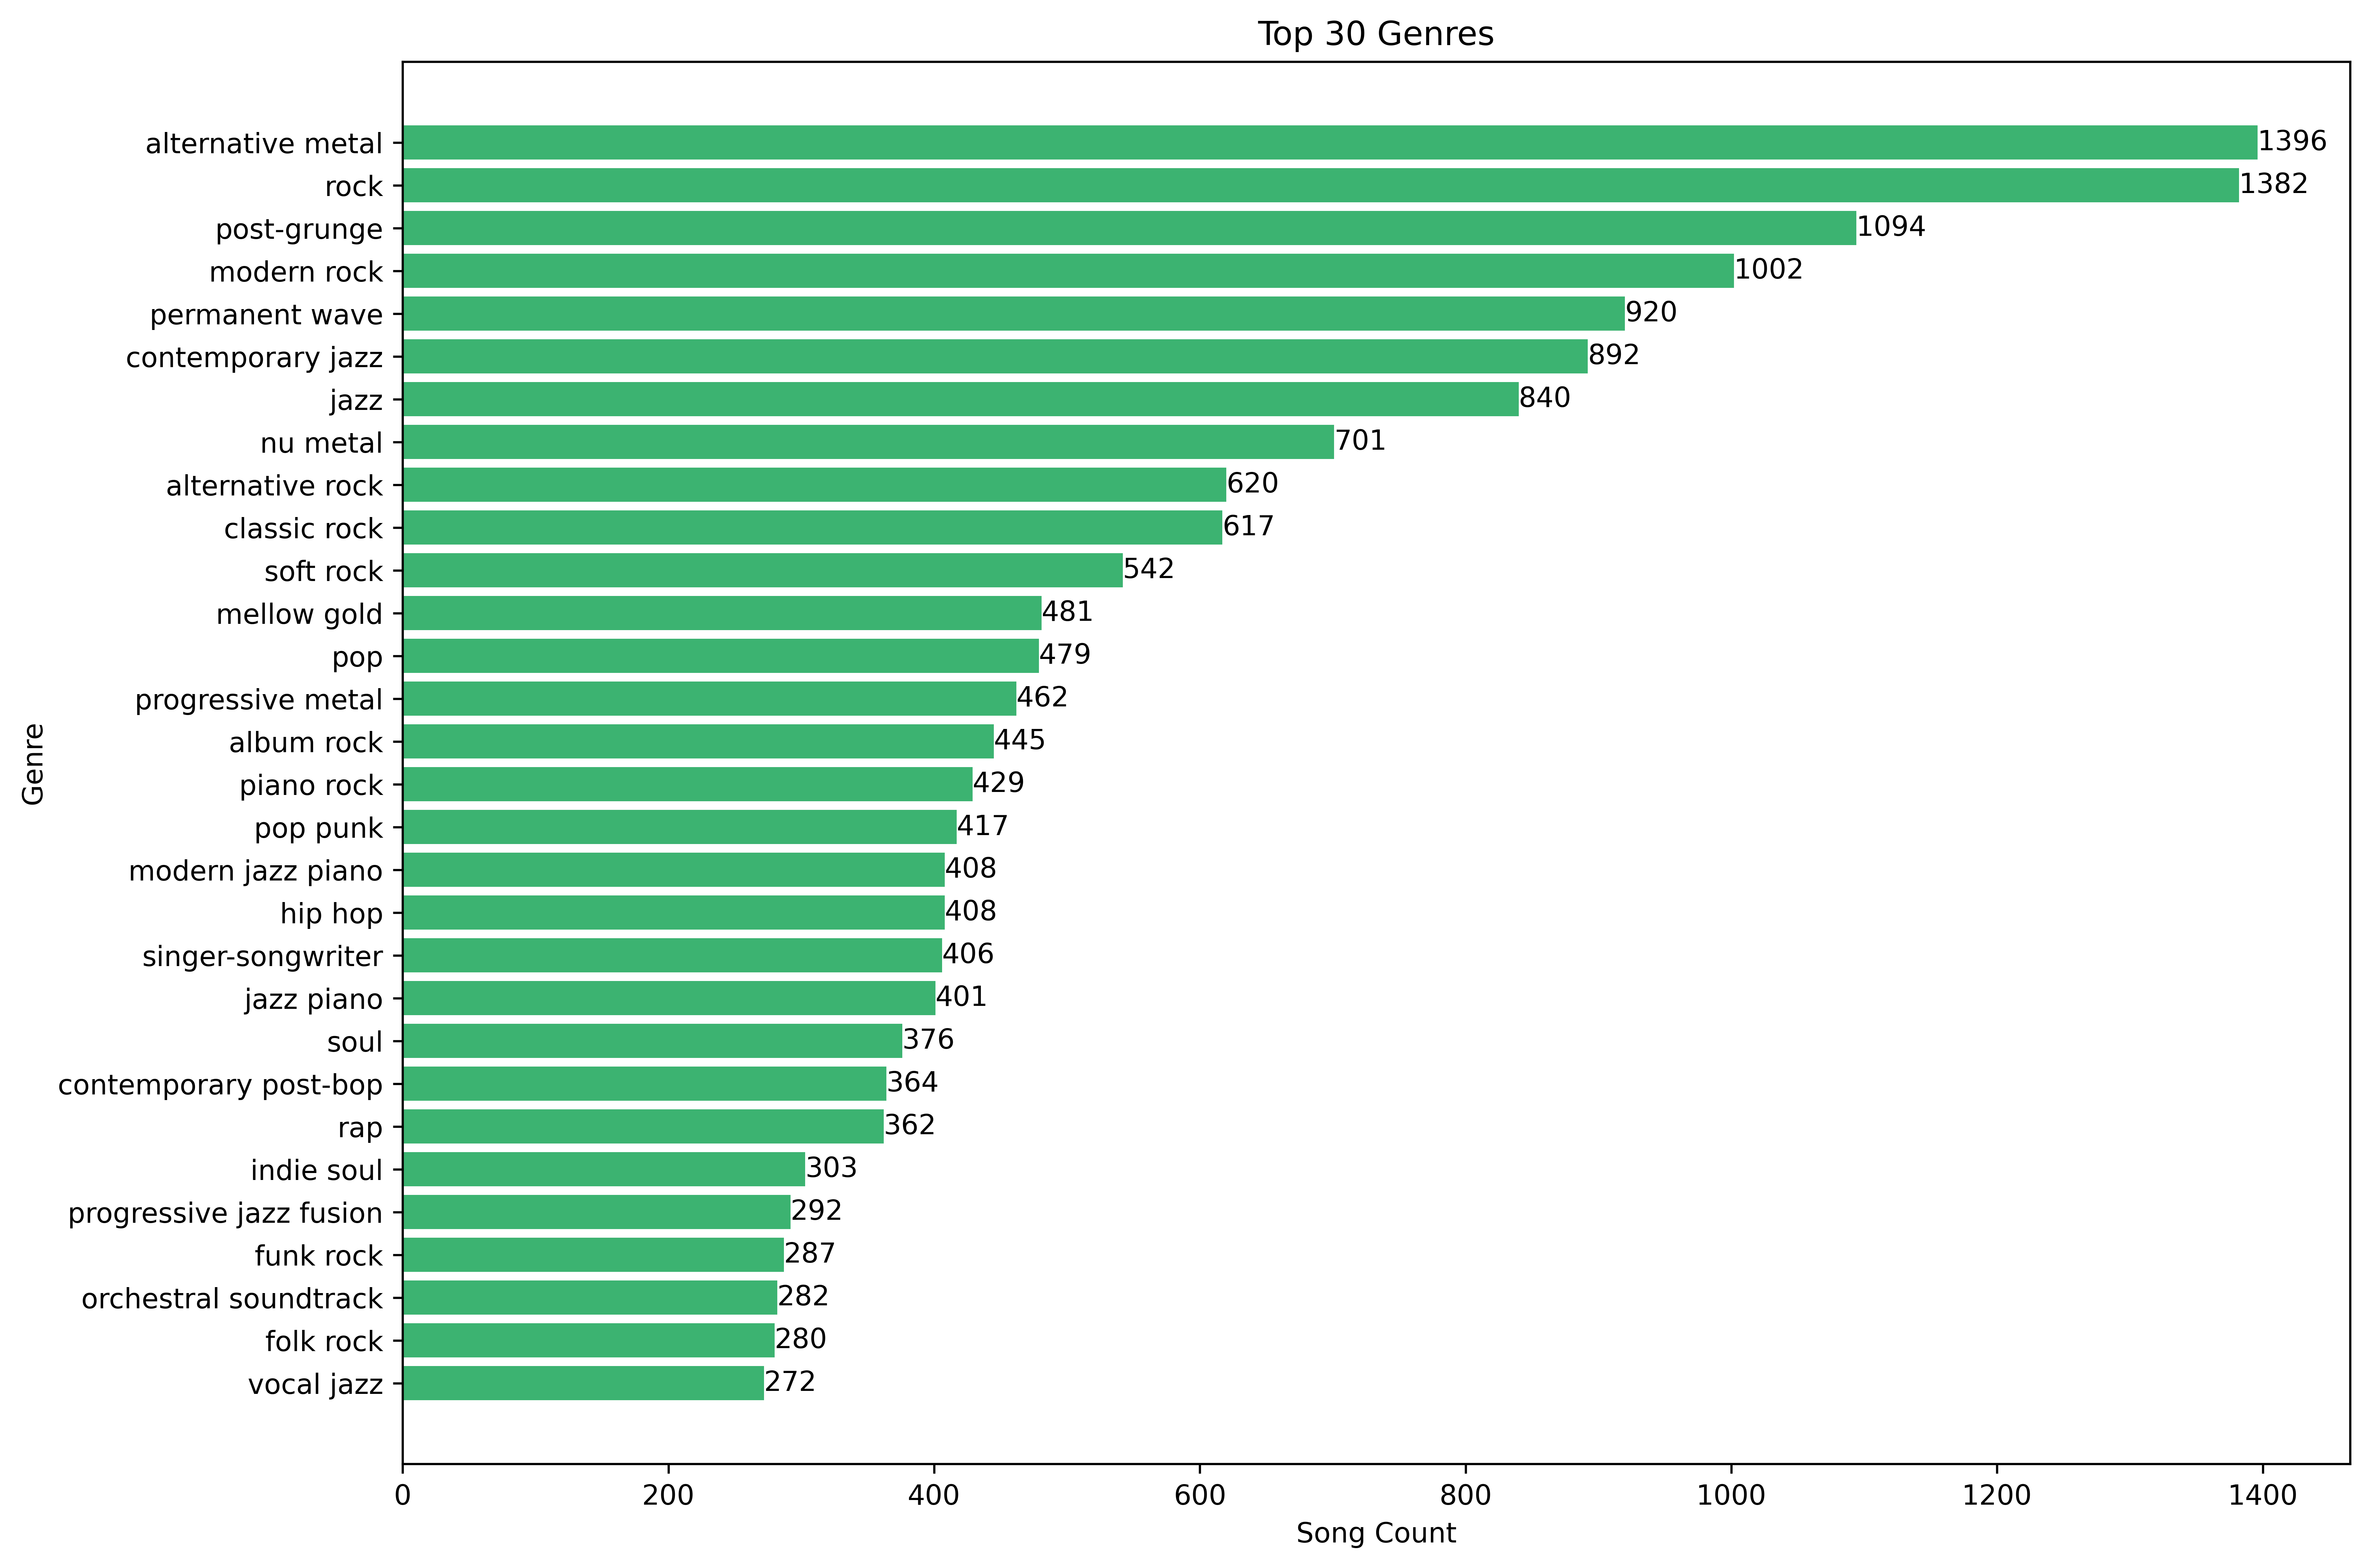
I had no idea what "permanent wave" or "mellow gold" were so had to look them up.
" Permanent wave is characterized by a heavy reliance on synthesizers and drum machines, as well as a strong emphasis
on melody and rhythm. It often combines elements of pop, funk, and rock music. "
" Mellow Gold contains elements of soft rock and folk rock, and has a strong correlation with album-oriented classic
rock of the '60s, '70s, and '80s. Emphasis is on clean production, harmonies, and melodic compositions. "
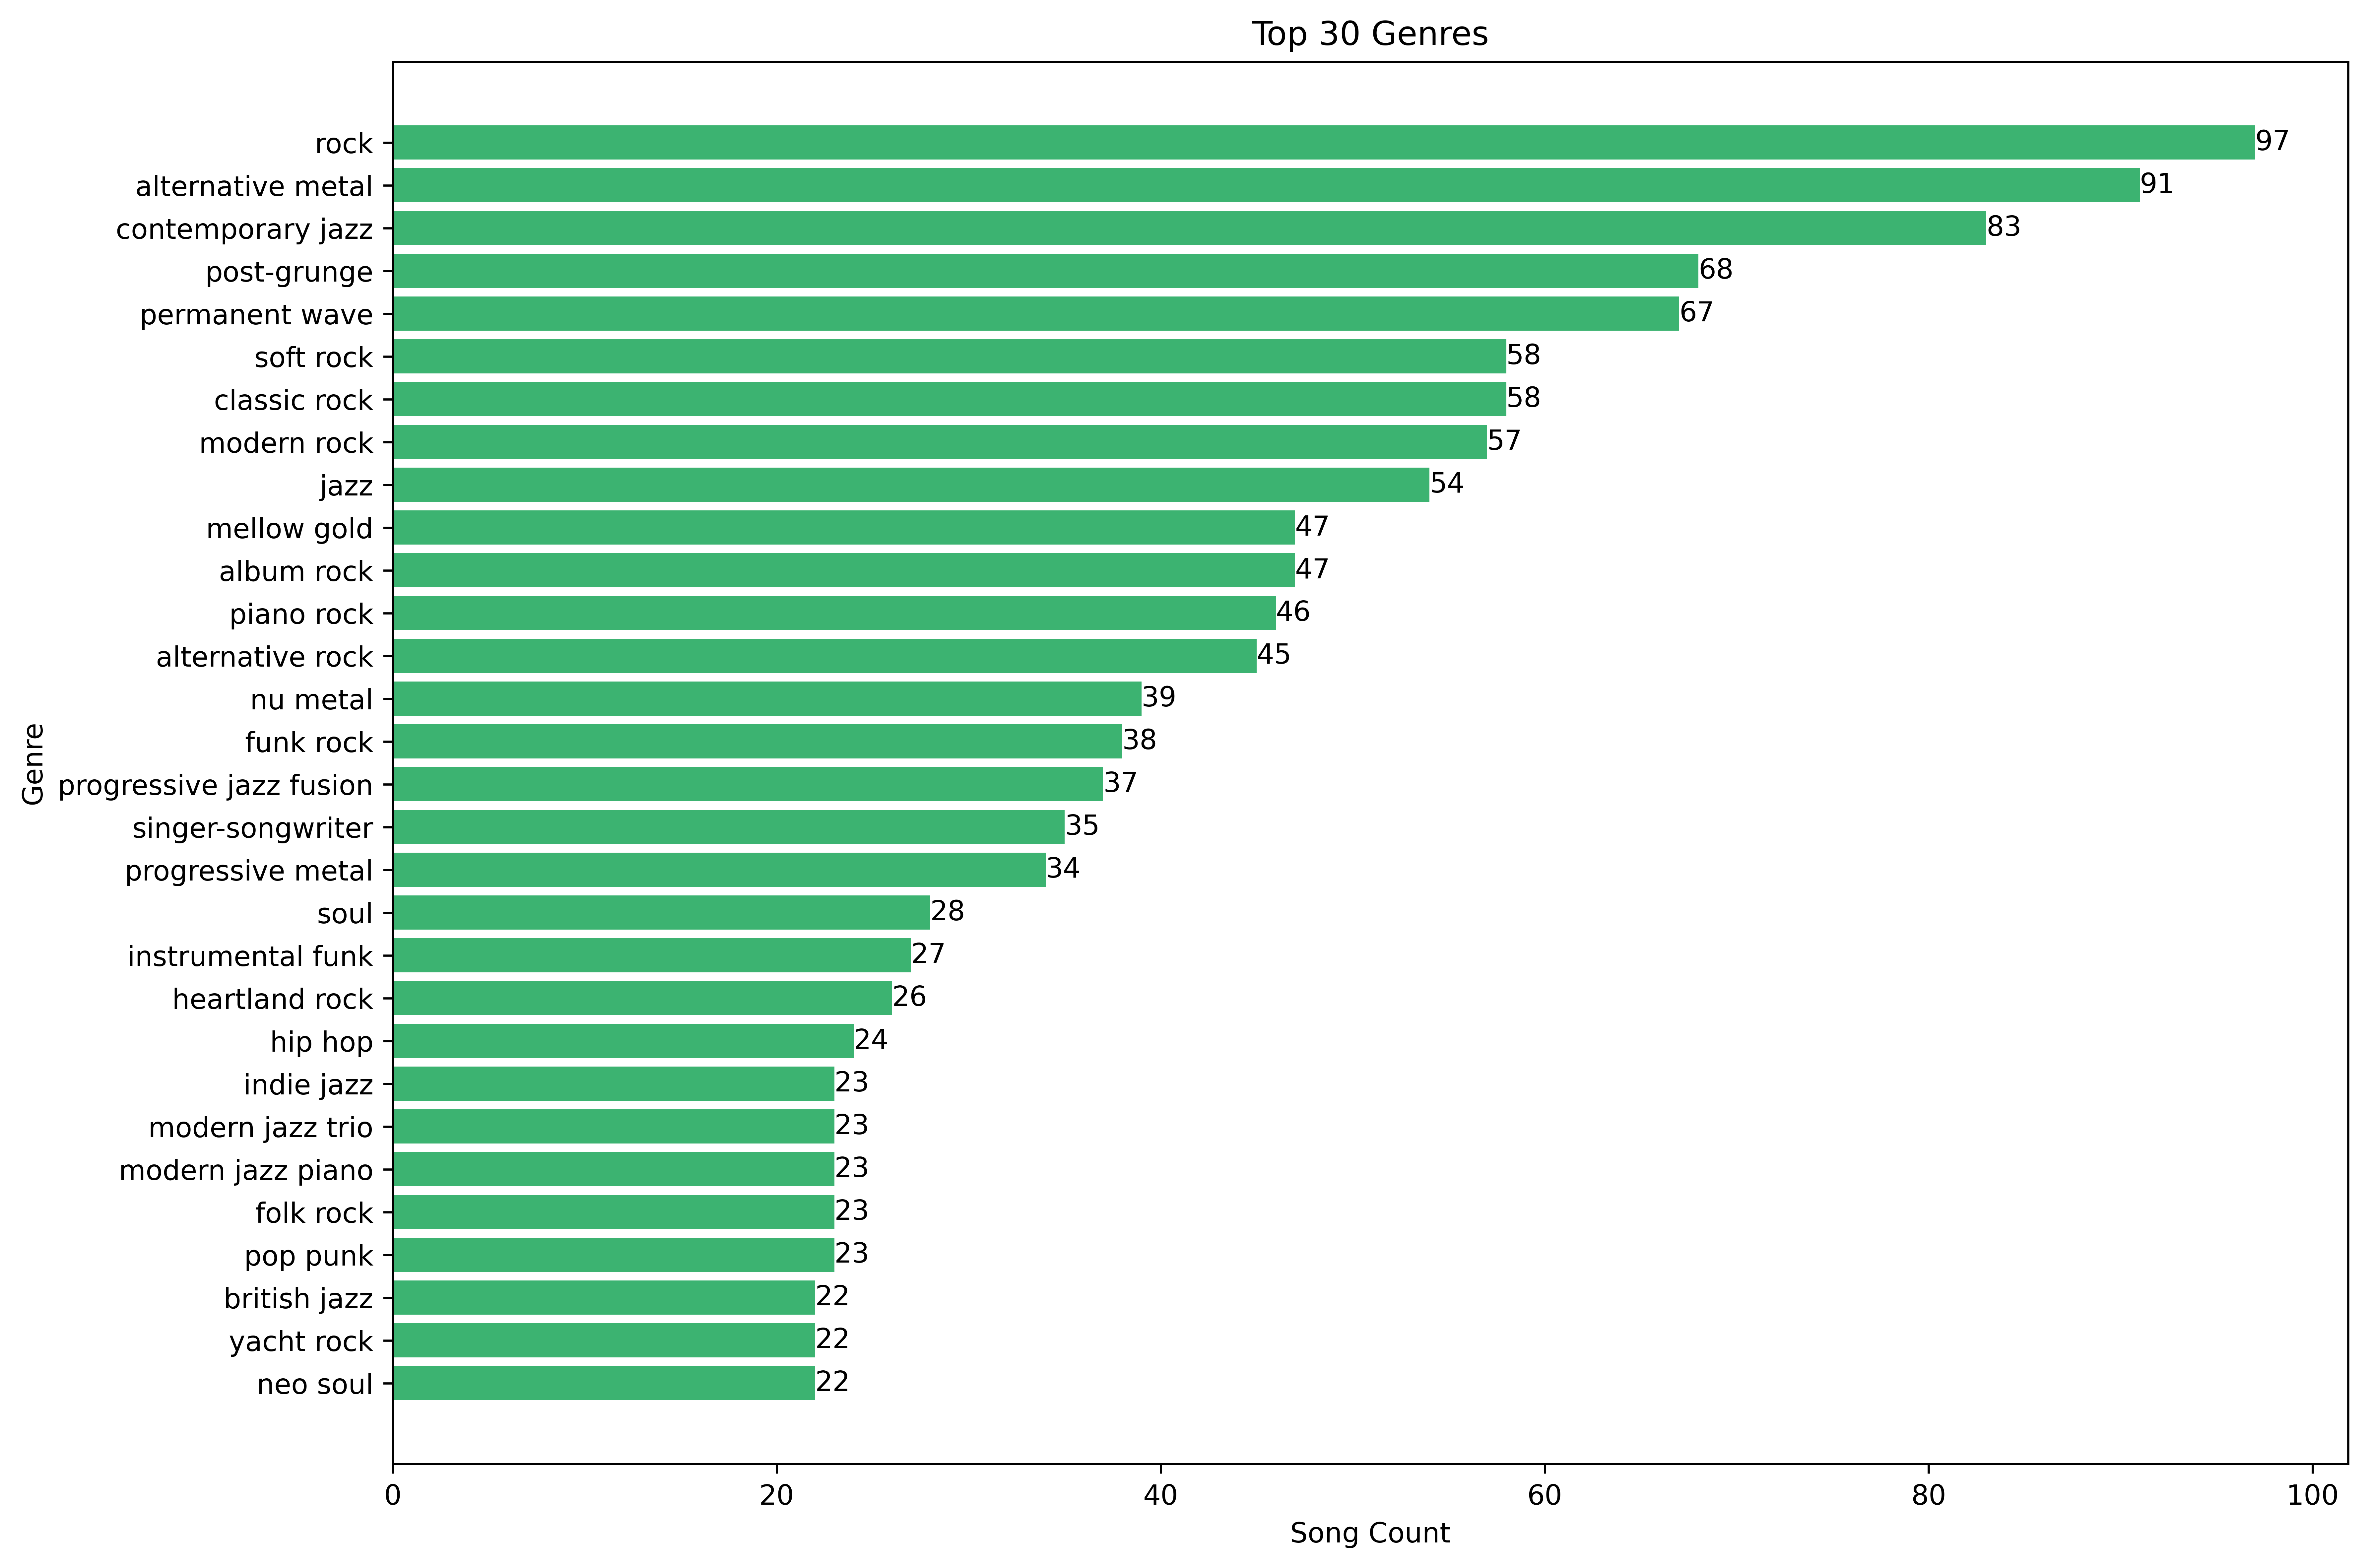
Never thought I'd be listening to "yacht rock".
Let's explore the distribution of song lengths.
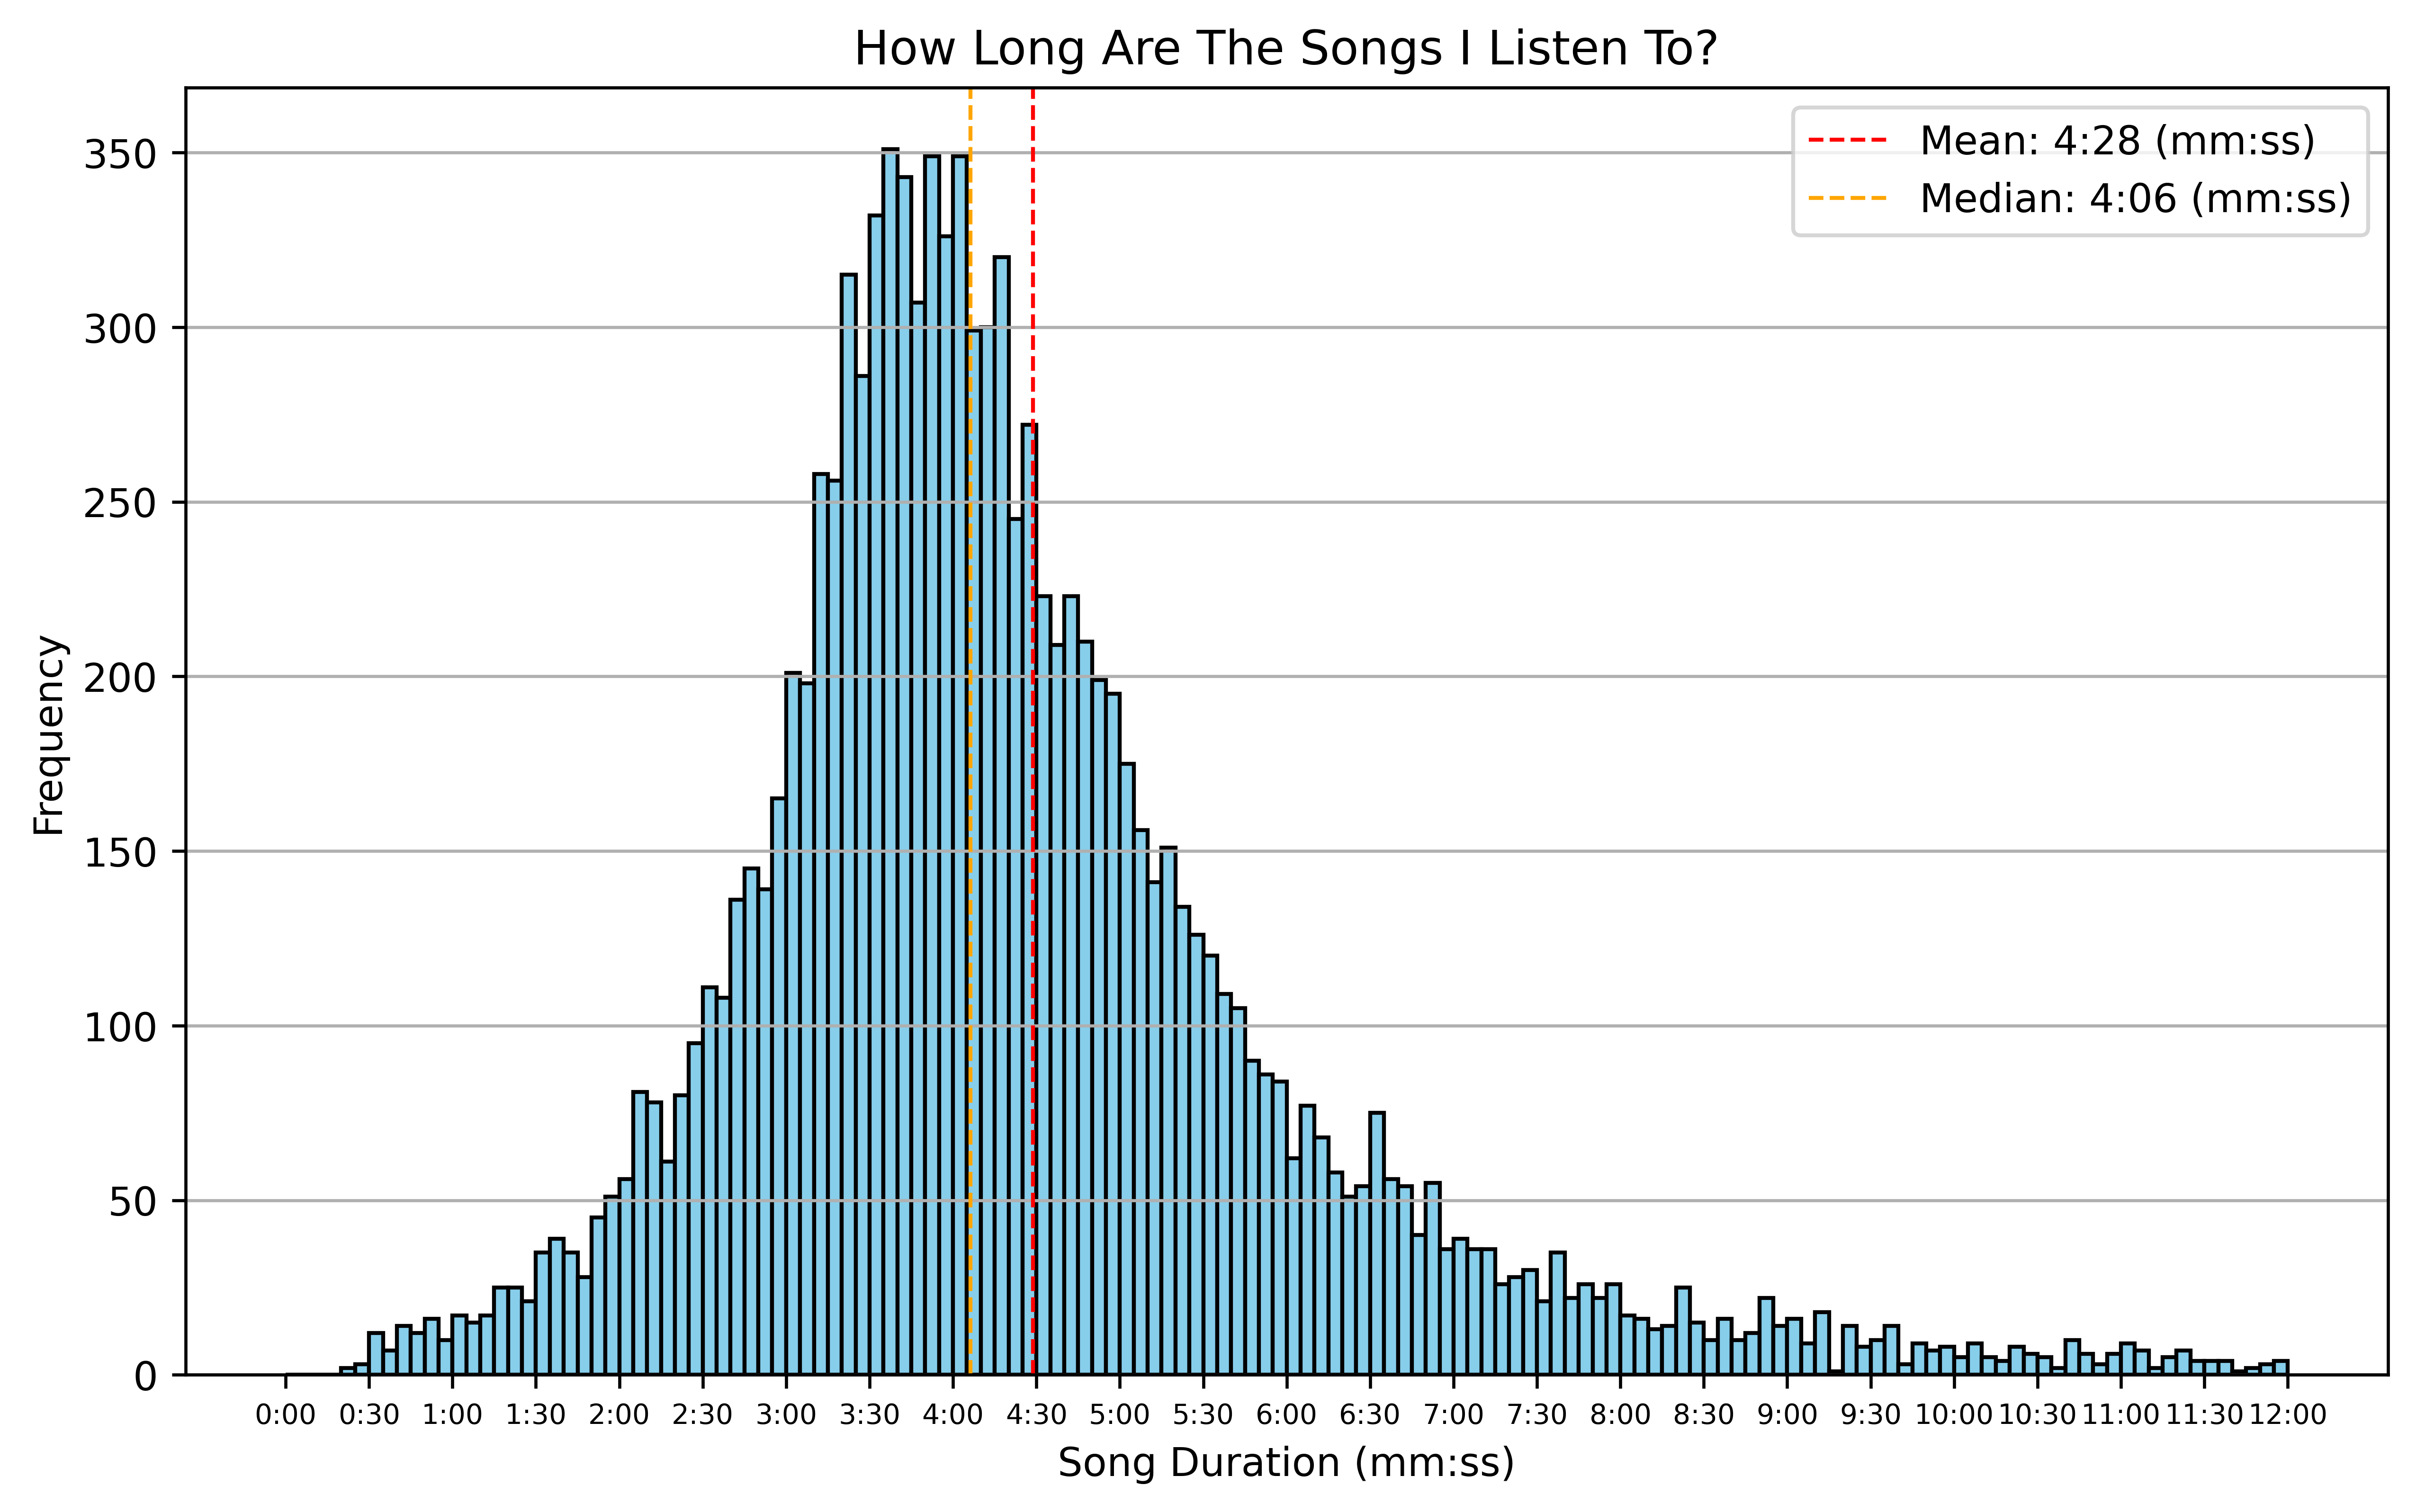
My average song is 4:28, which is quite a bit longer than the average (~3:30). I'd put this down to listening to a lot of jazz and metal, which tend to be longer. Interestingly, average song length has changed over time, gradually increasing since the 60s before reaching a peak around the early 90s at around 4 minutes.
Next, I wanted to see which era the songs that I listen to are from.
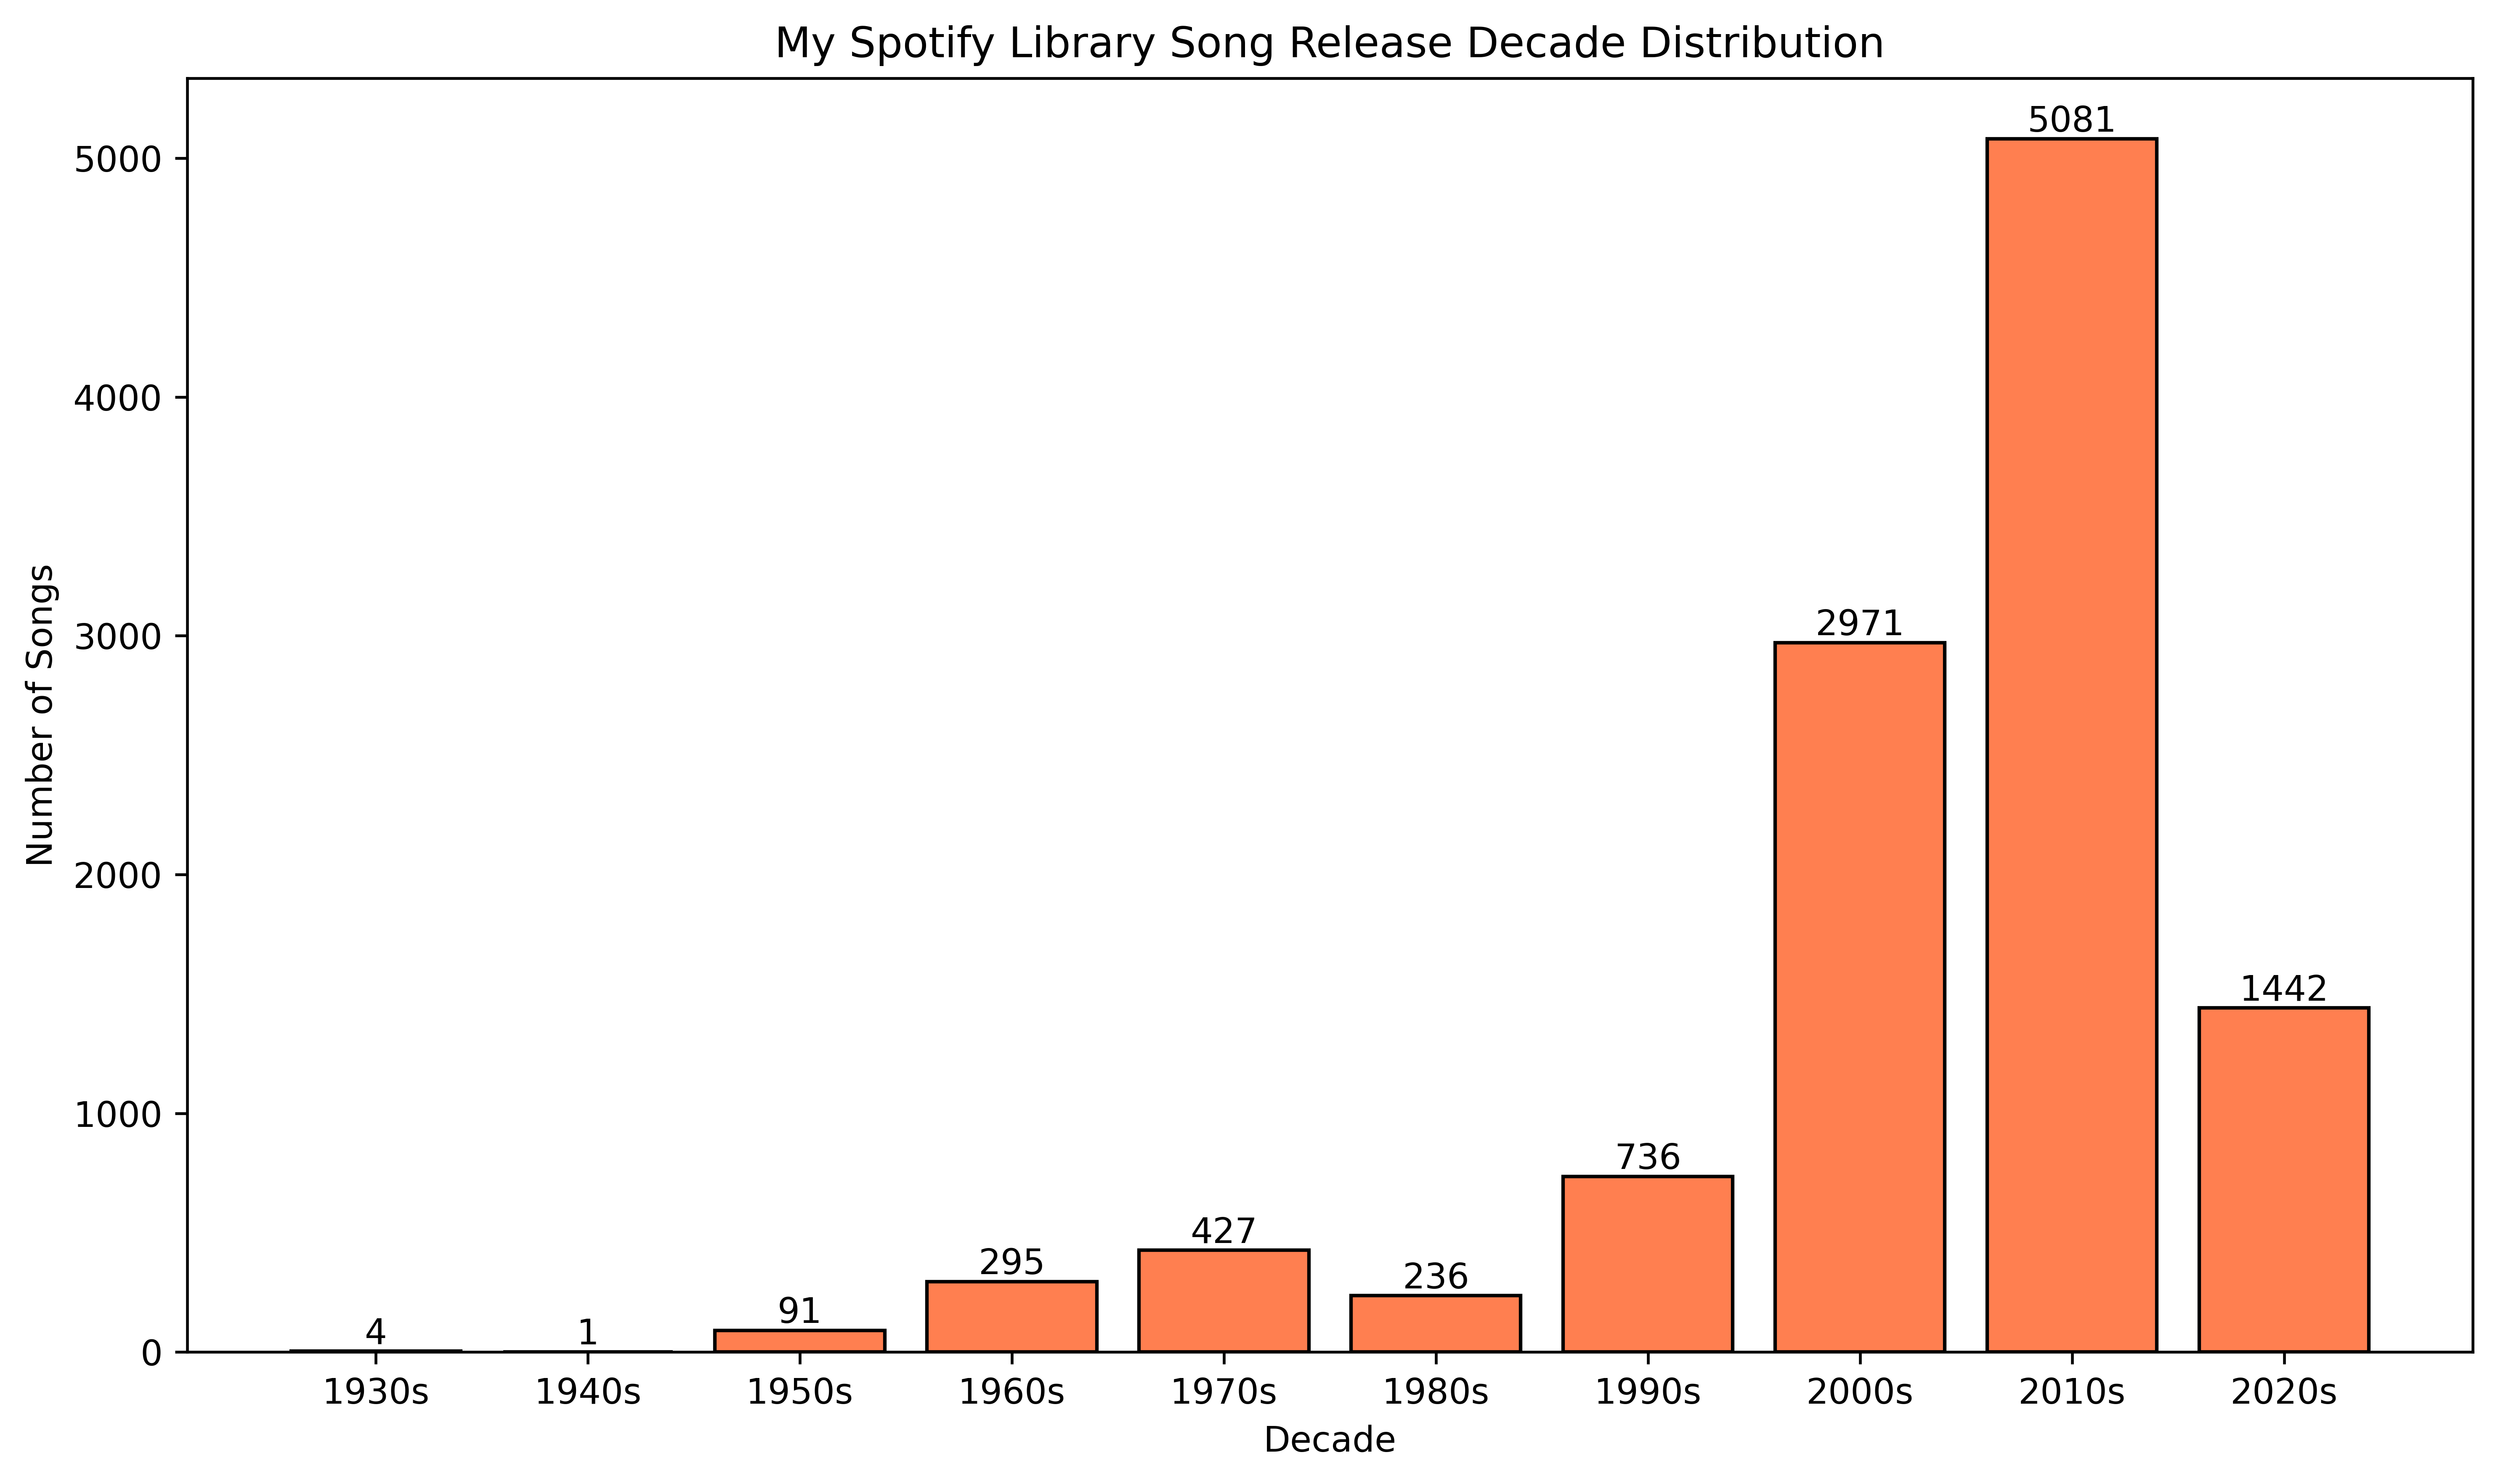
It looks like my musical taste exponentially decays the further back in time we travel, with a bit of a
lull around the 80s. I would expect it to be generally anchored around your birth year and grow from that
time onwards, as new music gets released during your lifetime. I was born in the 90s, so that checks out;
still, I'd be curious to test this by looking at the data for people of different ages. The amount of music
released has also grown over time (check out this
cool blog post by Sebastian
Schöner), which might contribute towards this exponential decay shape. Personal preference almost certainly
plays a part, too — despite being a millennial, I'm a big fan of older music, especially from the 70s.
What about for my "Current Favorites" playlist?
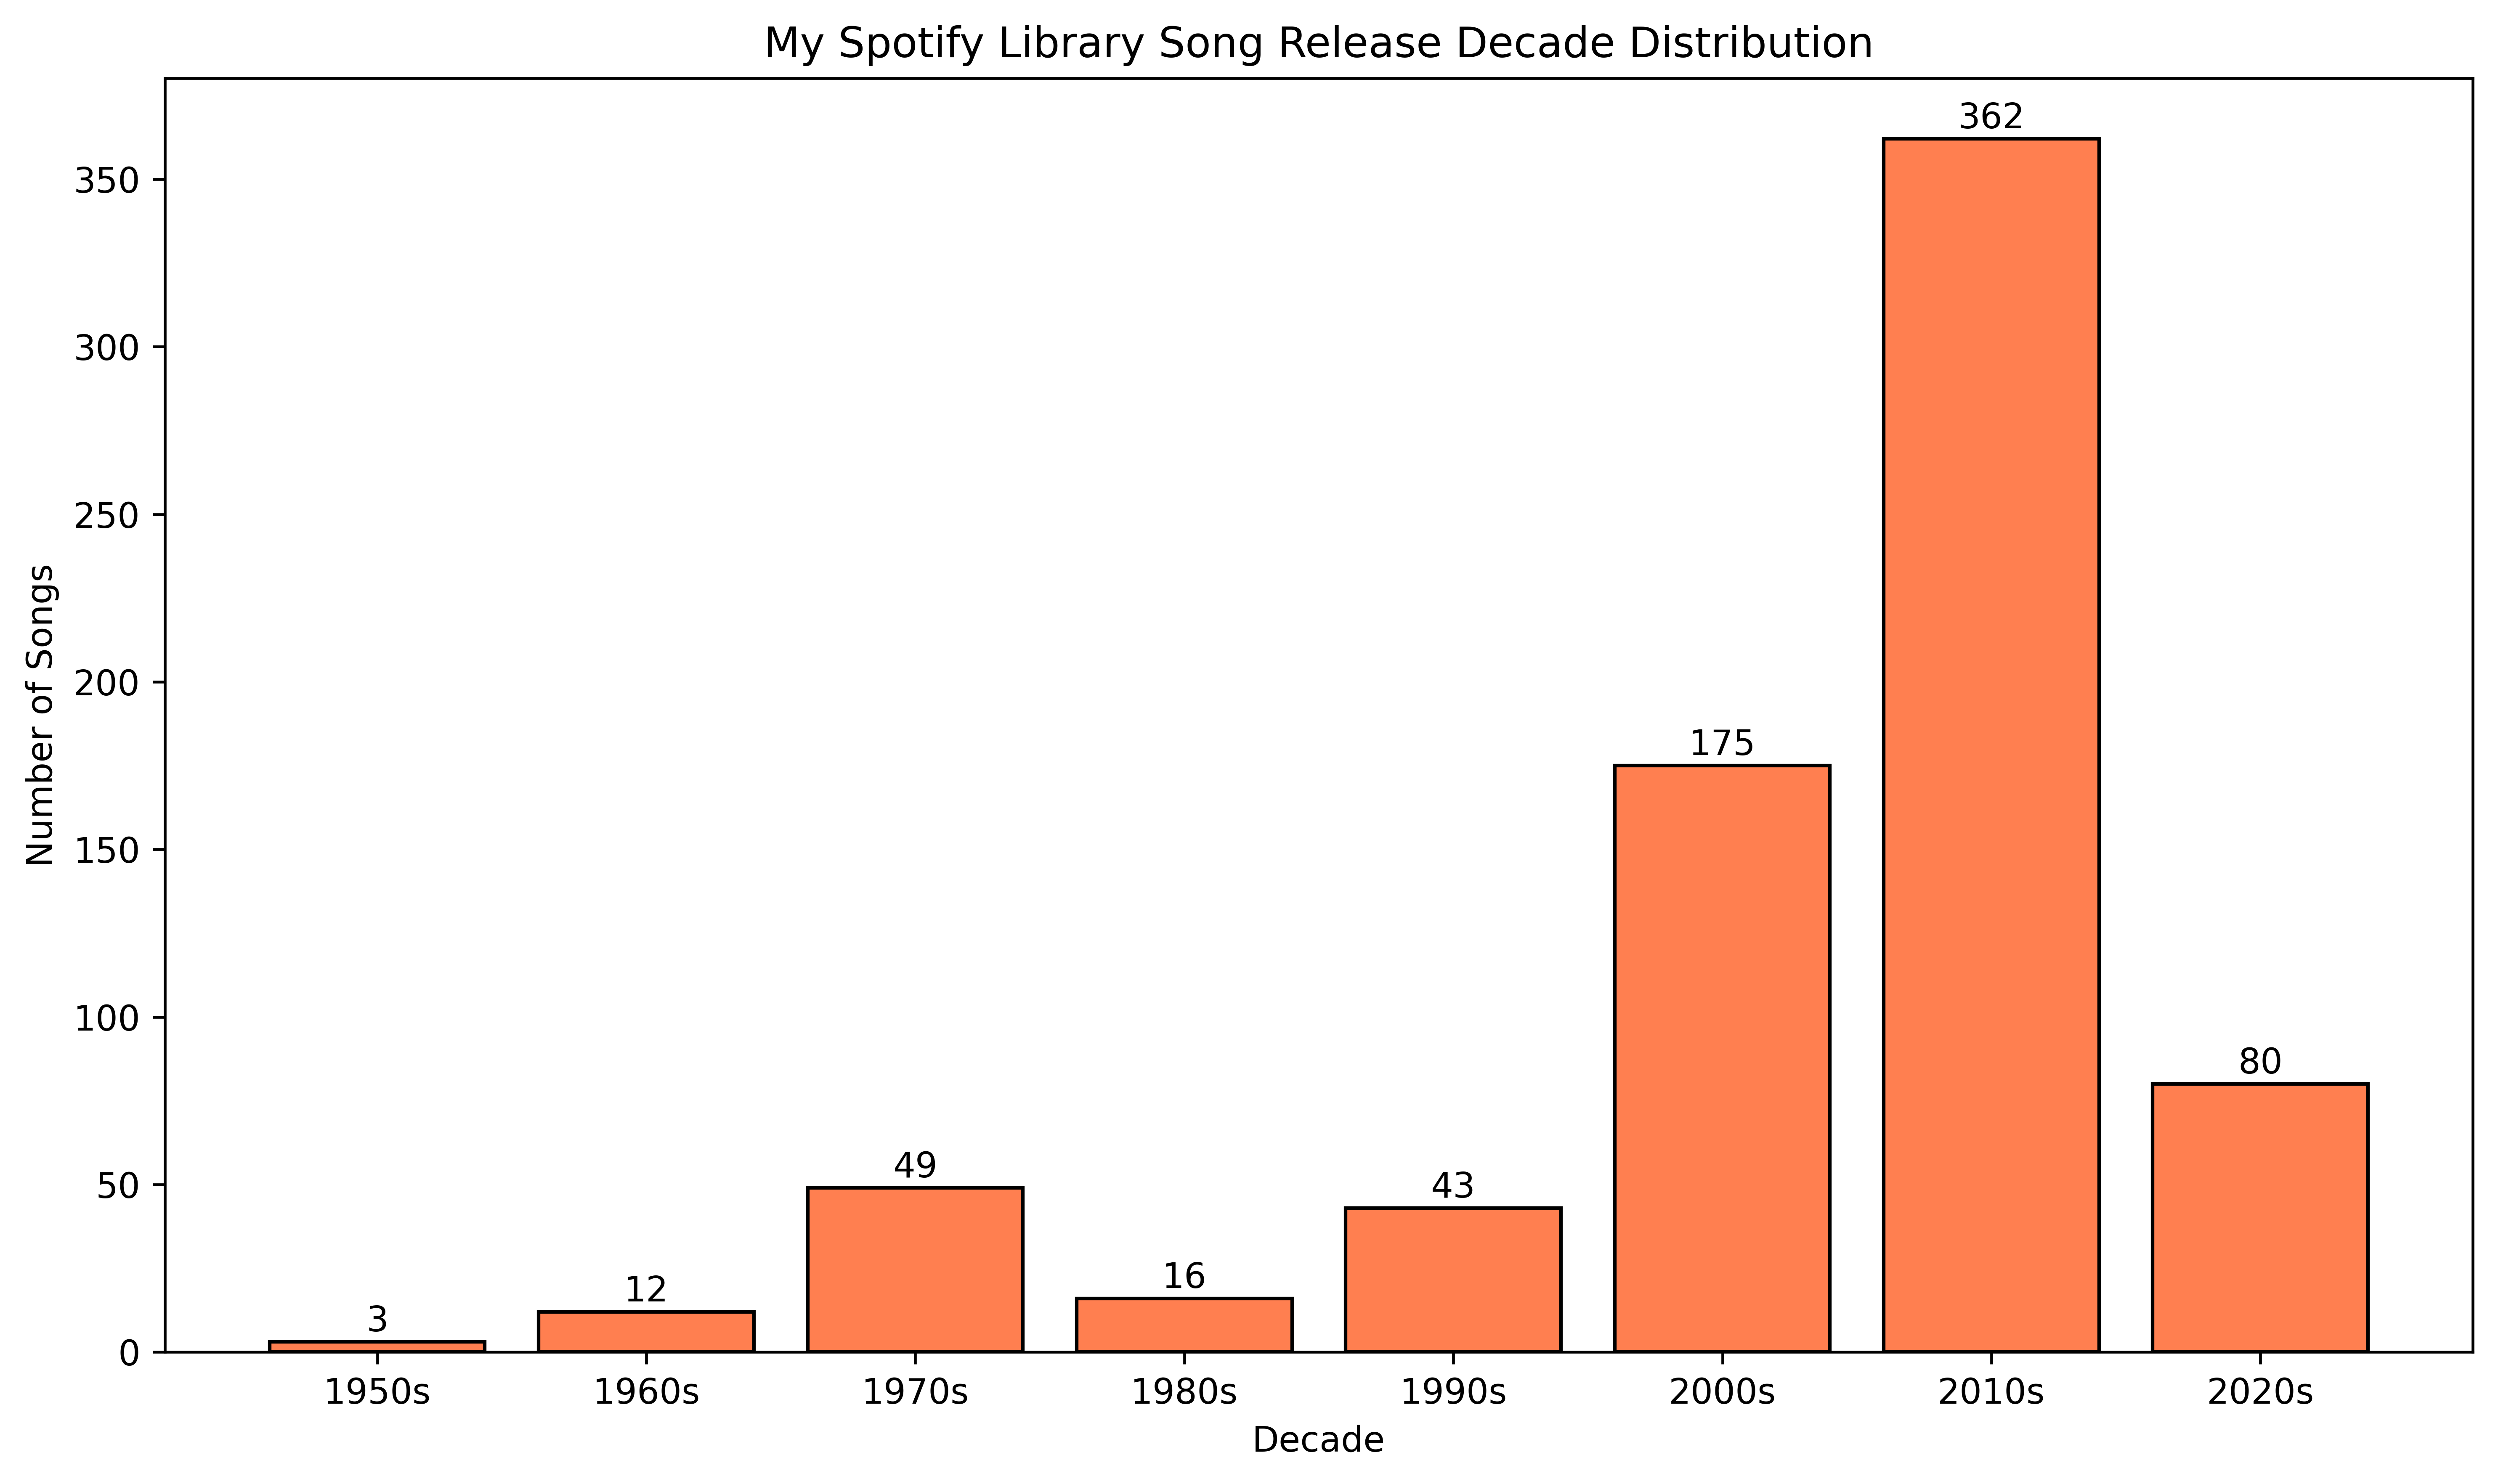
Pretty much the same distribution, except more songs from the 70s!
Let's look in more detail by plotting the exact years instead of the decades. "Liked Songs" on top and "Current Favorites" below.
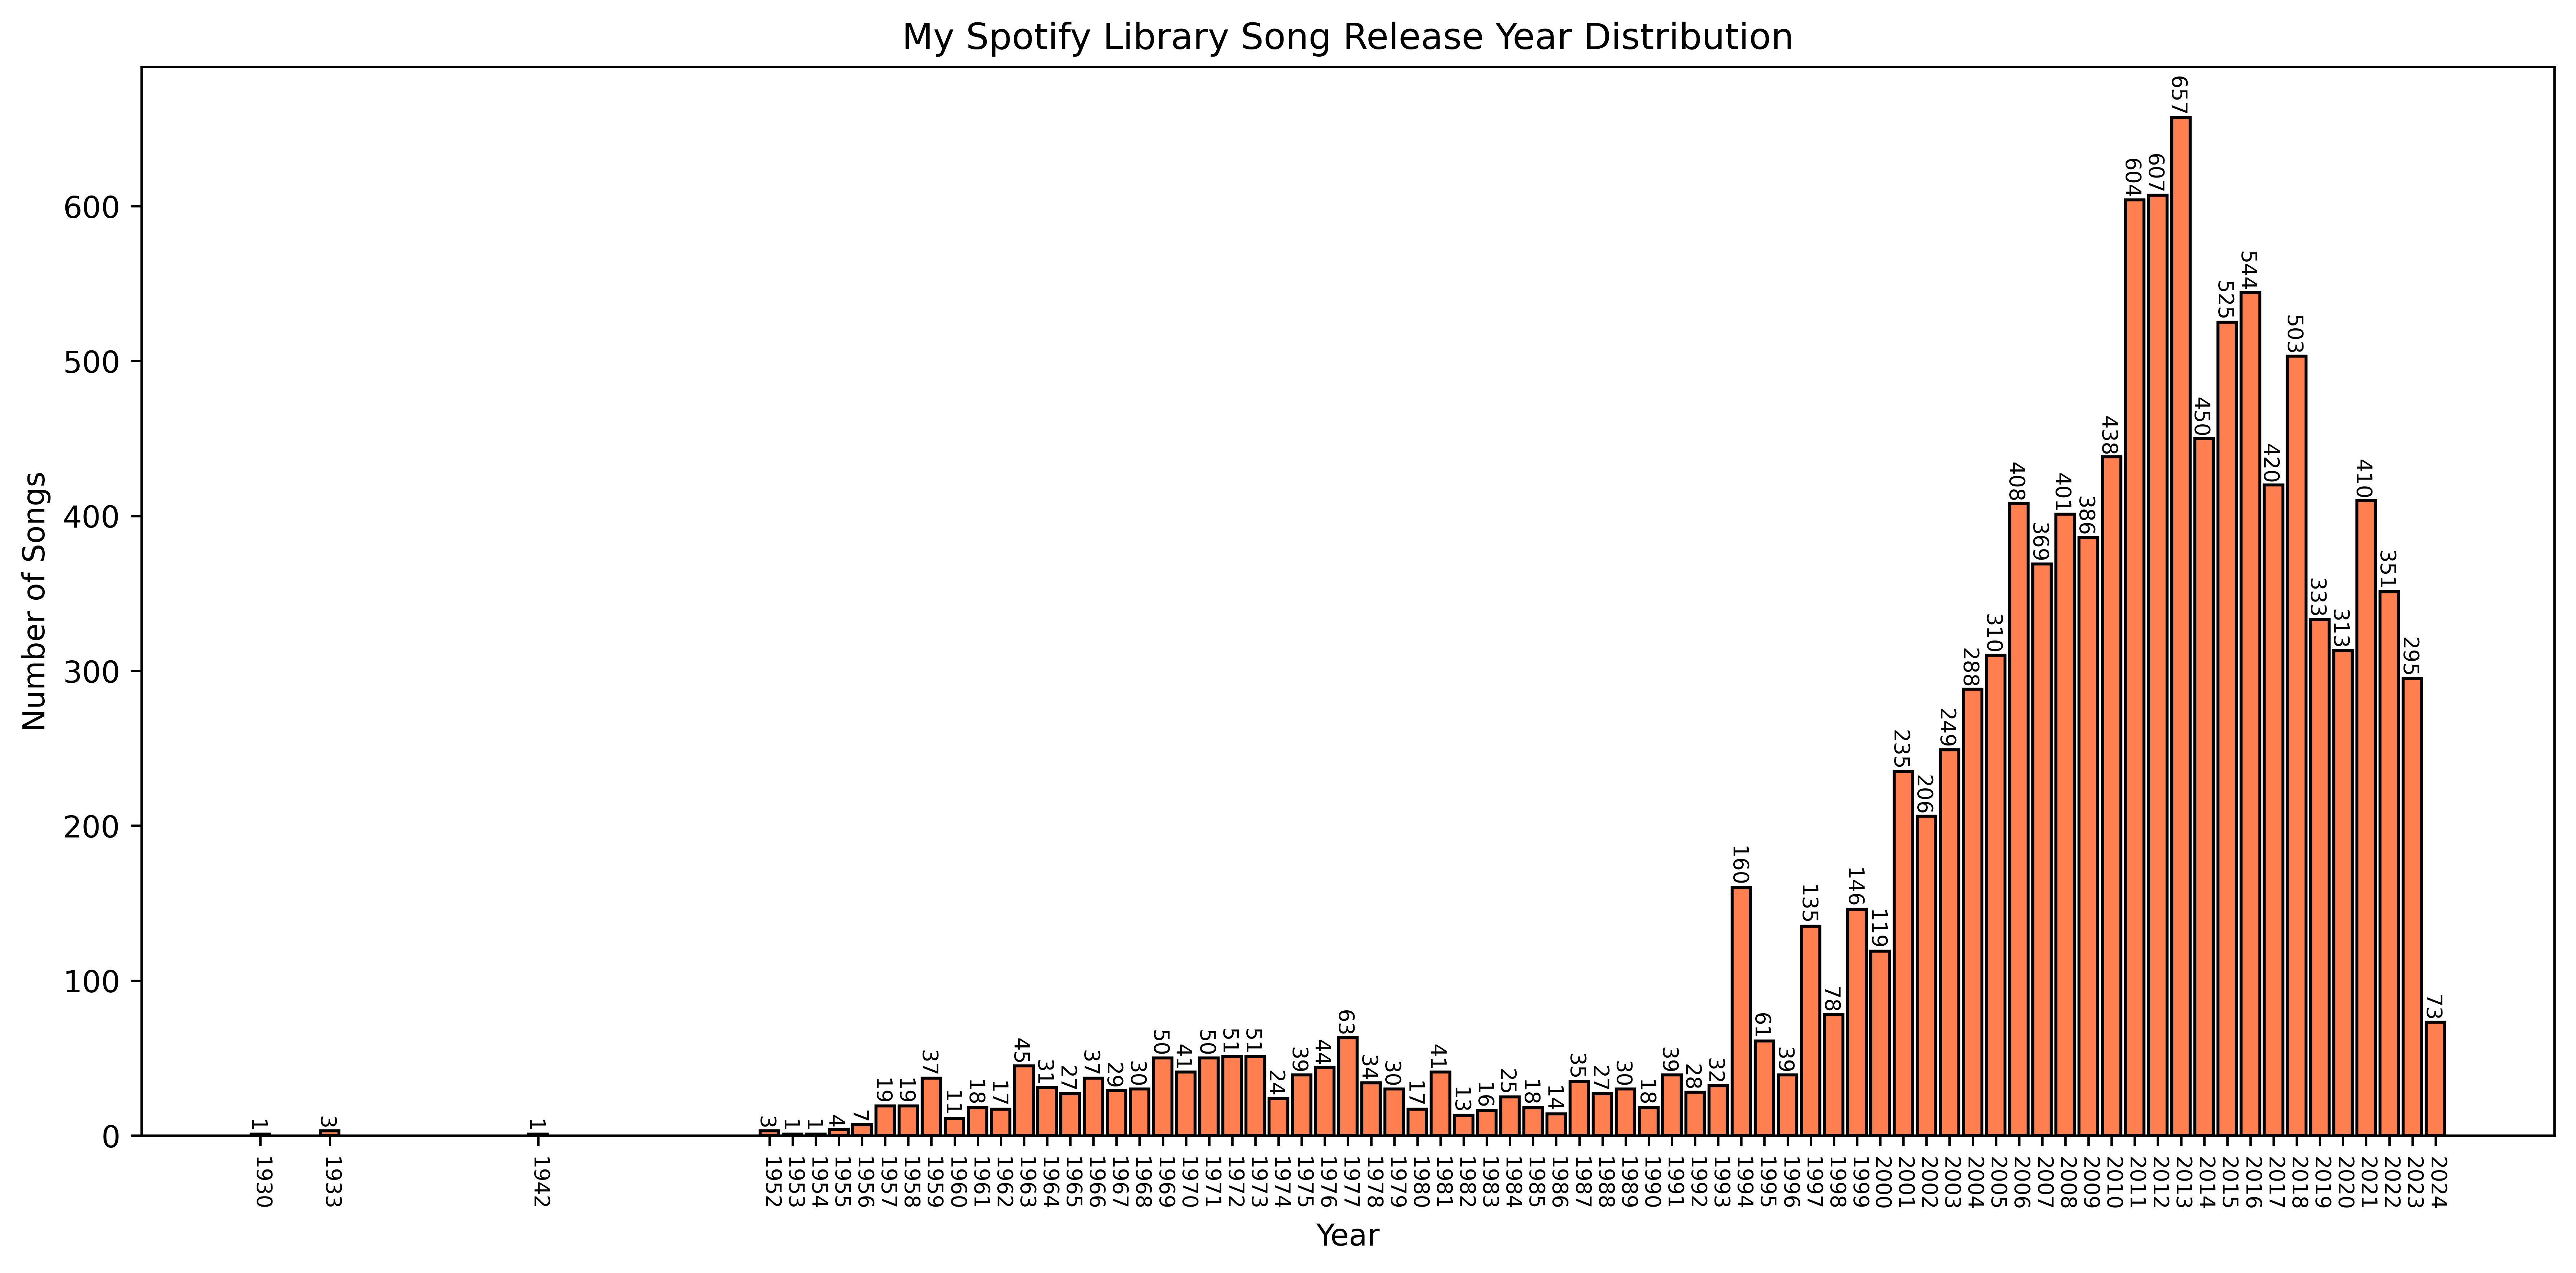
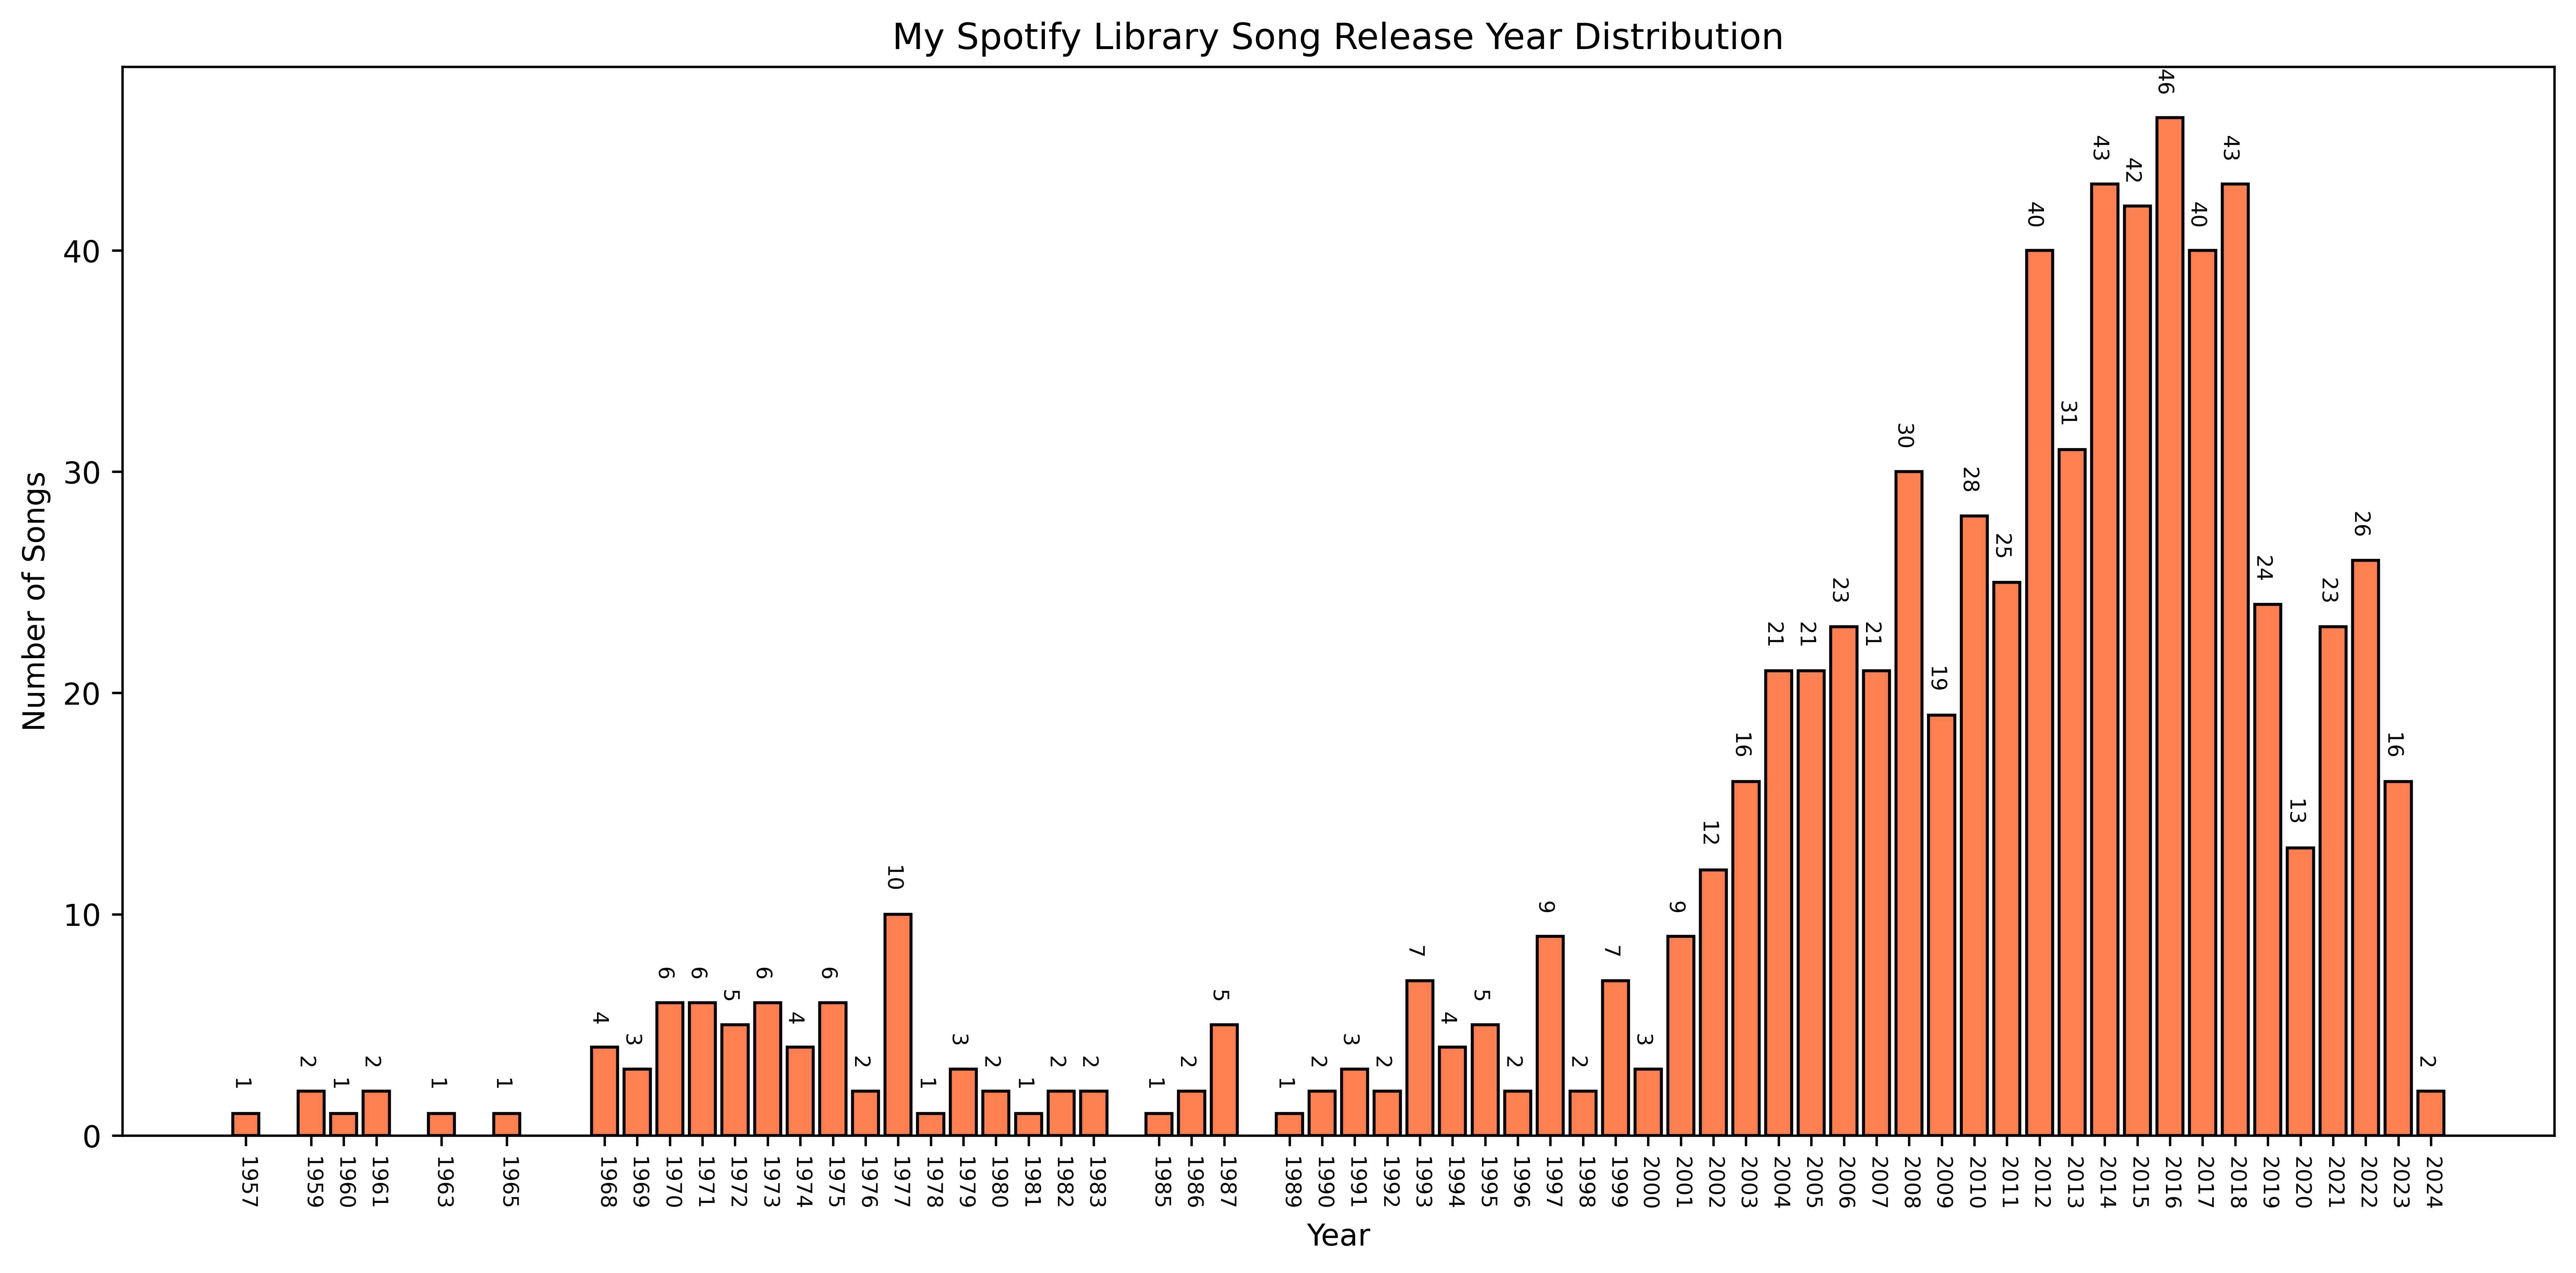
Seems like 2013 is my overall favorite year for music, with 657 songs coming from that year alone! My favorites playlist peaks a bit later, around 2016. I wonder in the dip at 2020 was due to the pandemic.
I started using Spotify in 2011. However, Spotify subsequently changed the way that songs were saved into playlists.
In 2017 I started using the "Liked Songs" feature, and added all the songs from my previous playlists there.
So let's take a look at how I added music to my library from 2017 onwards. I tracked the dates when songs
were added to my library to see when I've been most active in saving music.
*Note* in Sep 2021 I added a whole bunch of songs at once, so we should ignore this datapoint.
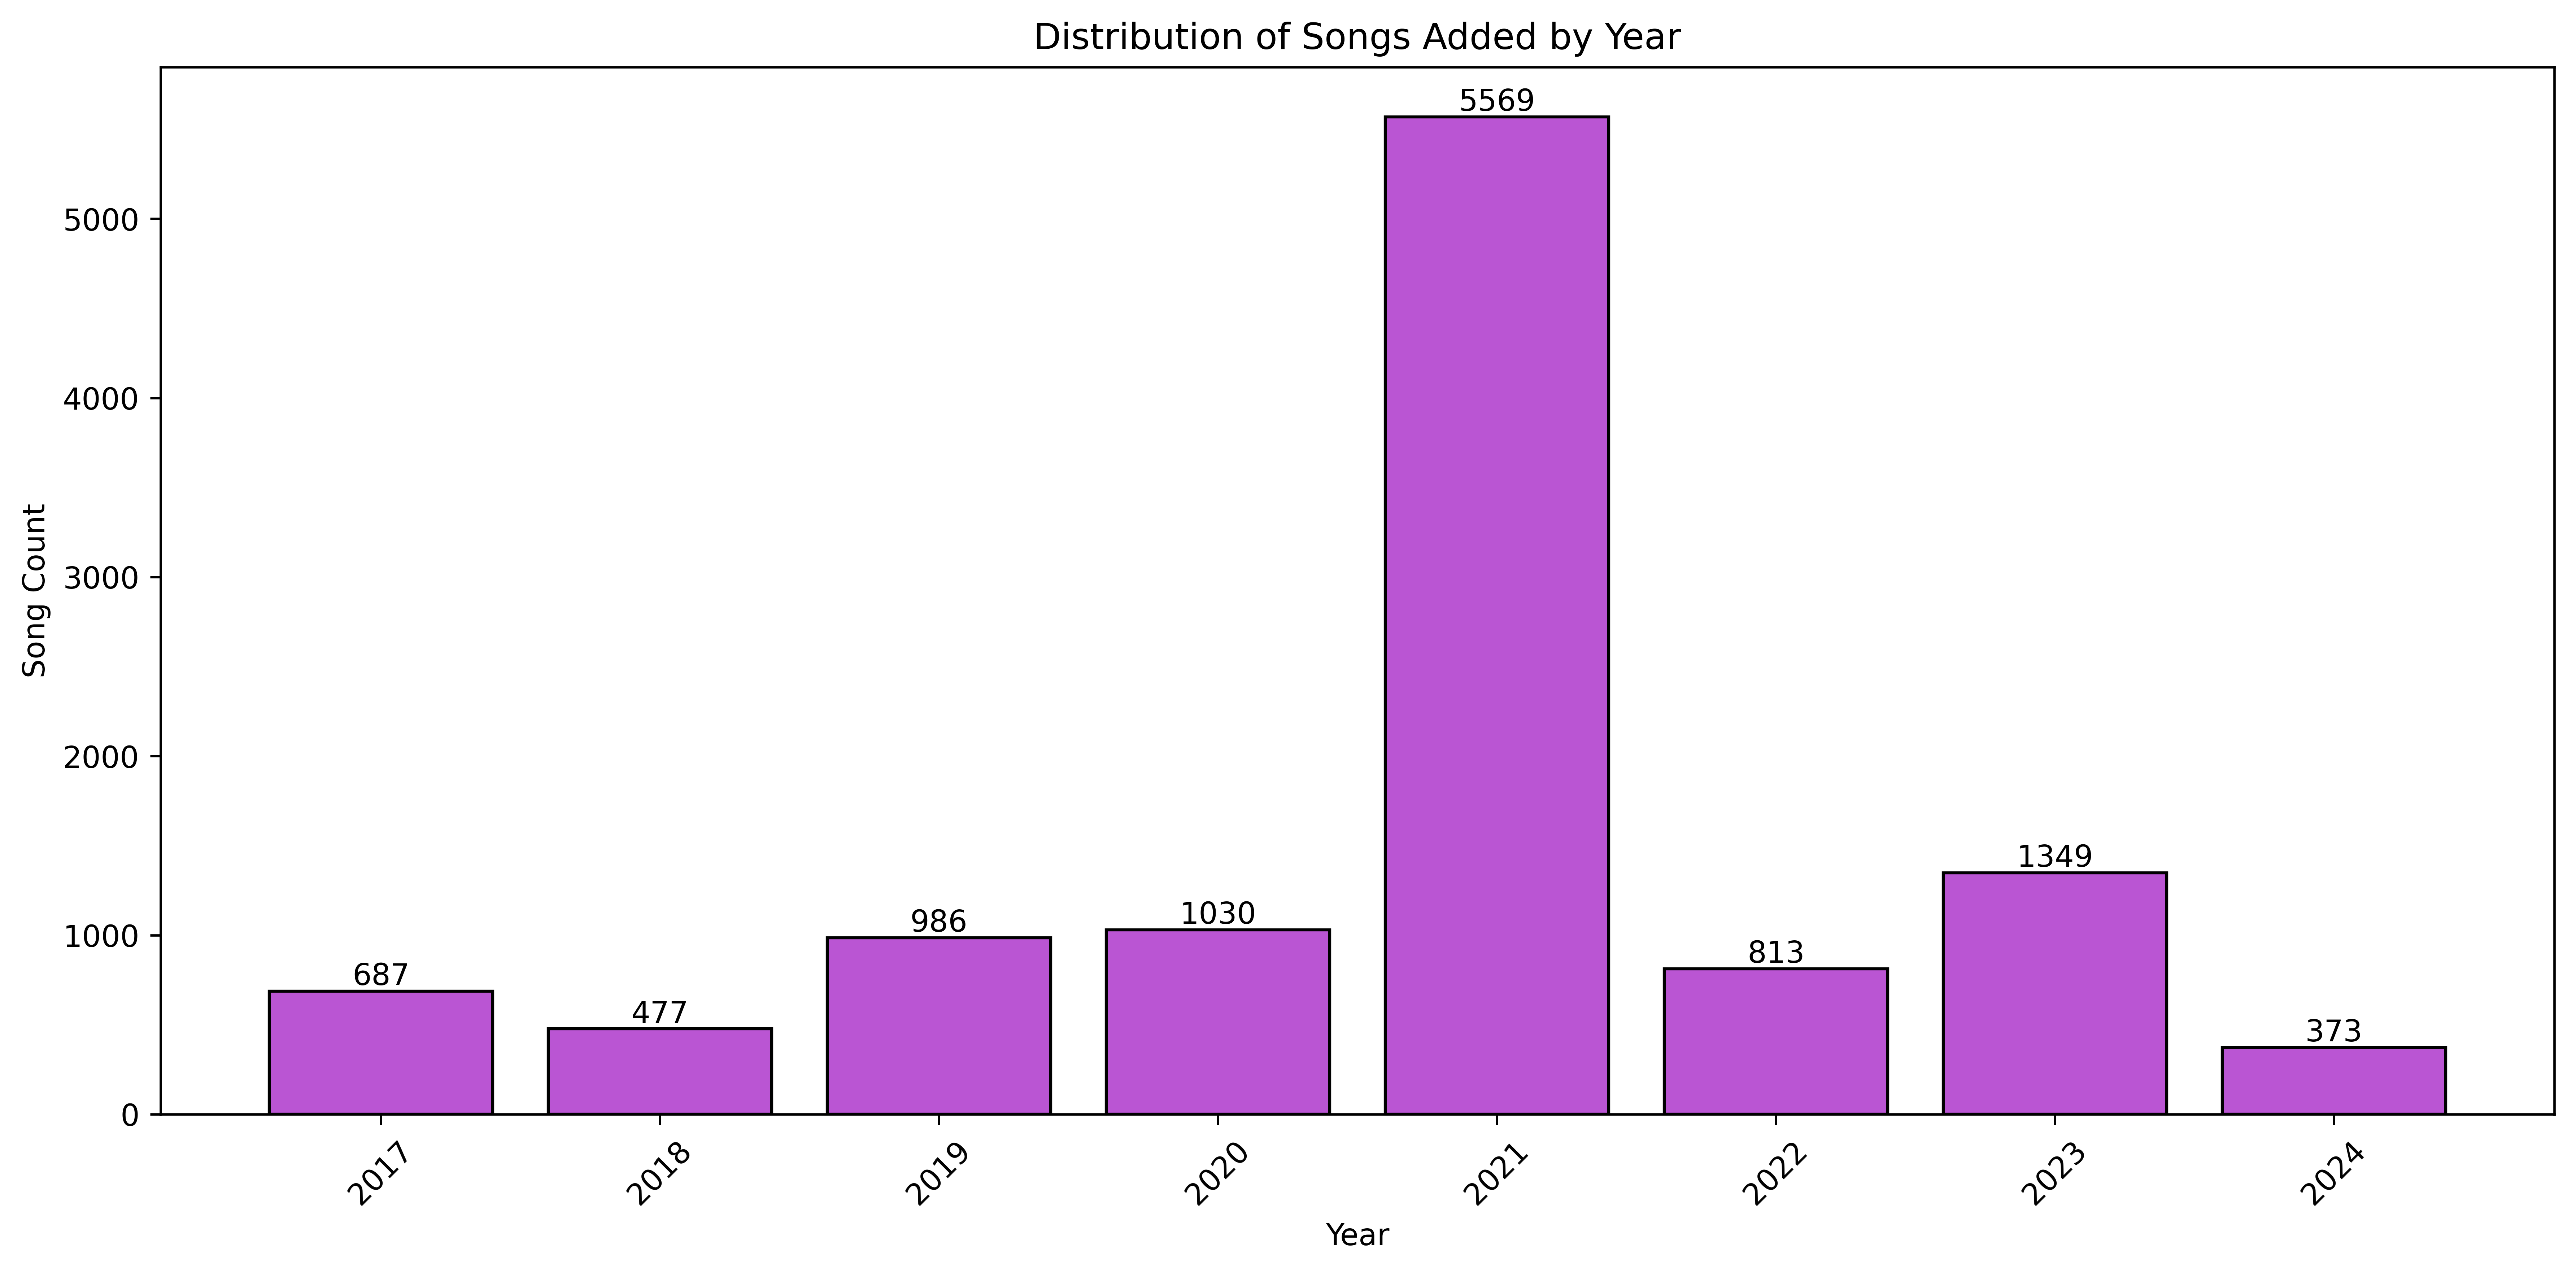
It looks like 2023 was a big year for music exploration! During the pandemic years, I also added quite a lot of songs. I was traveling for a large part of 2024, which might explain the dip there. Let's look at a monthly breakdown to see which months of the year I'm generally most active.
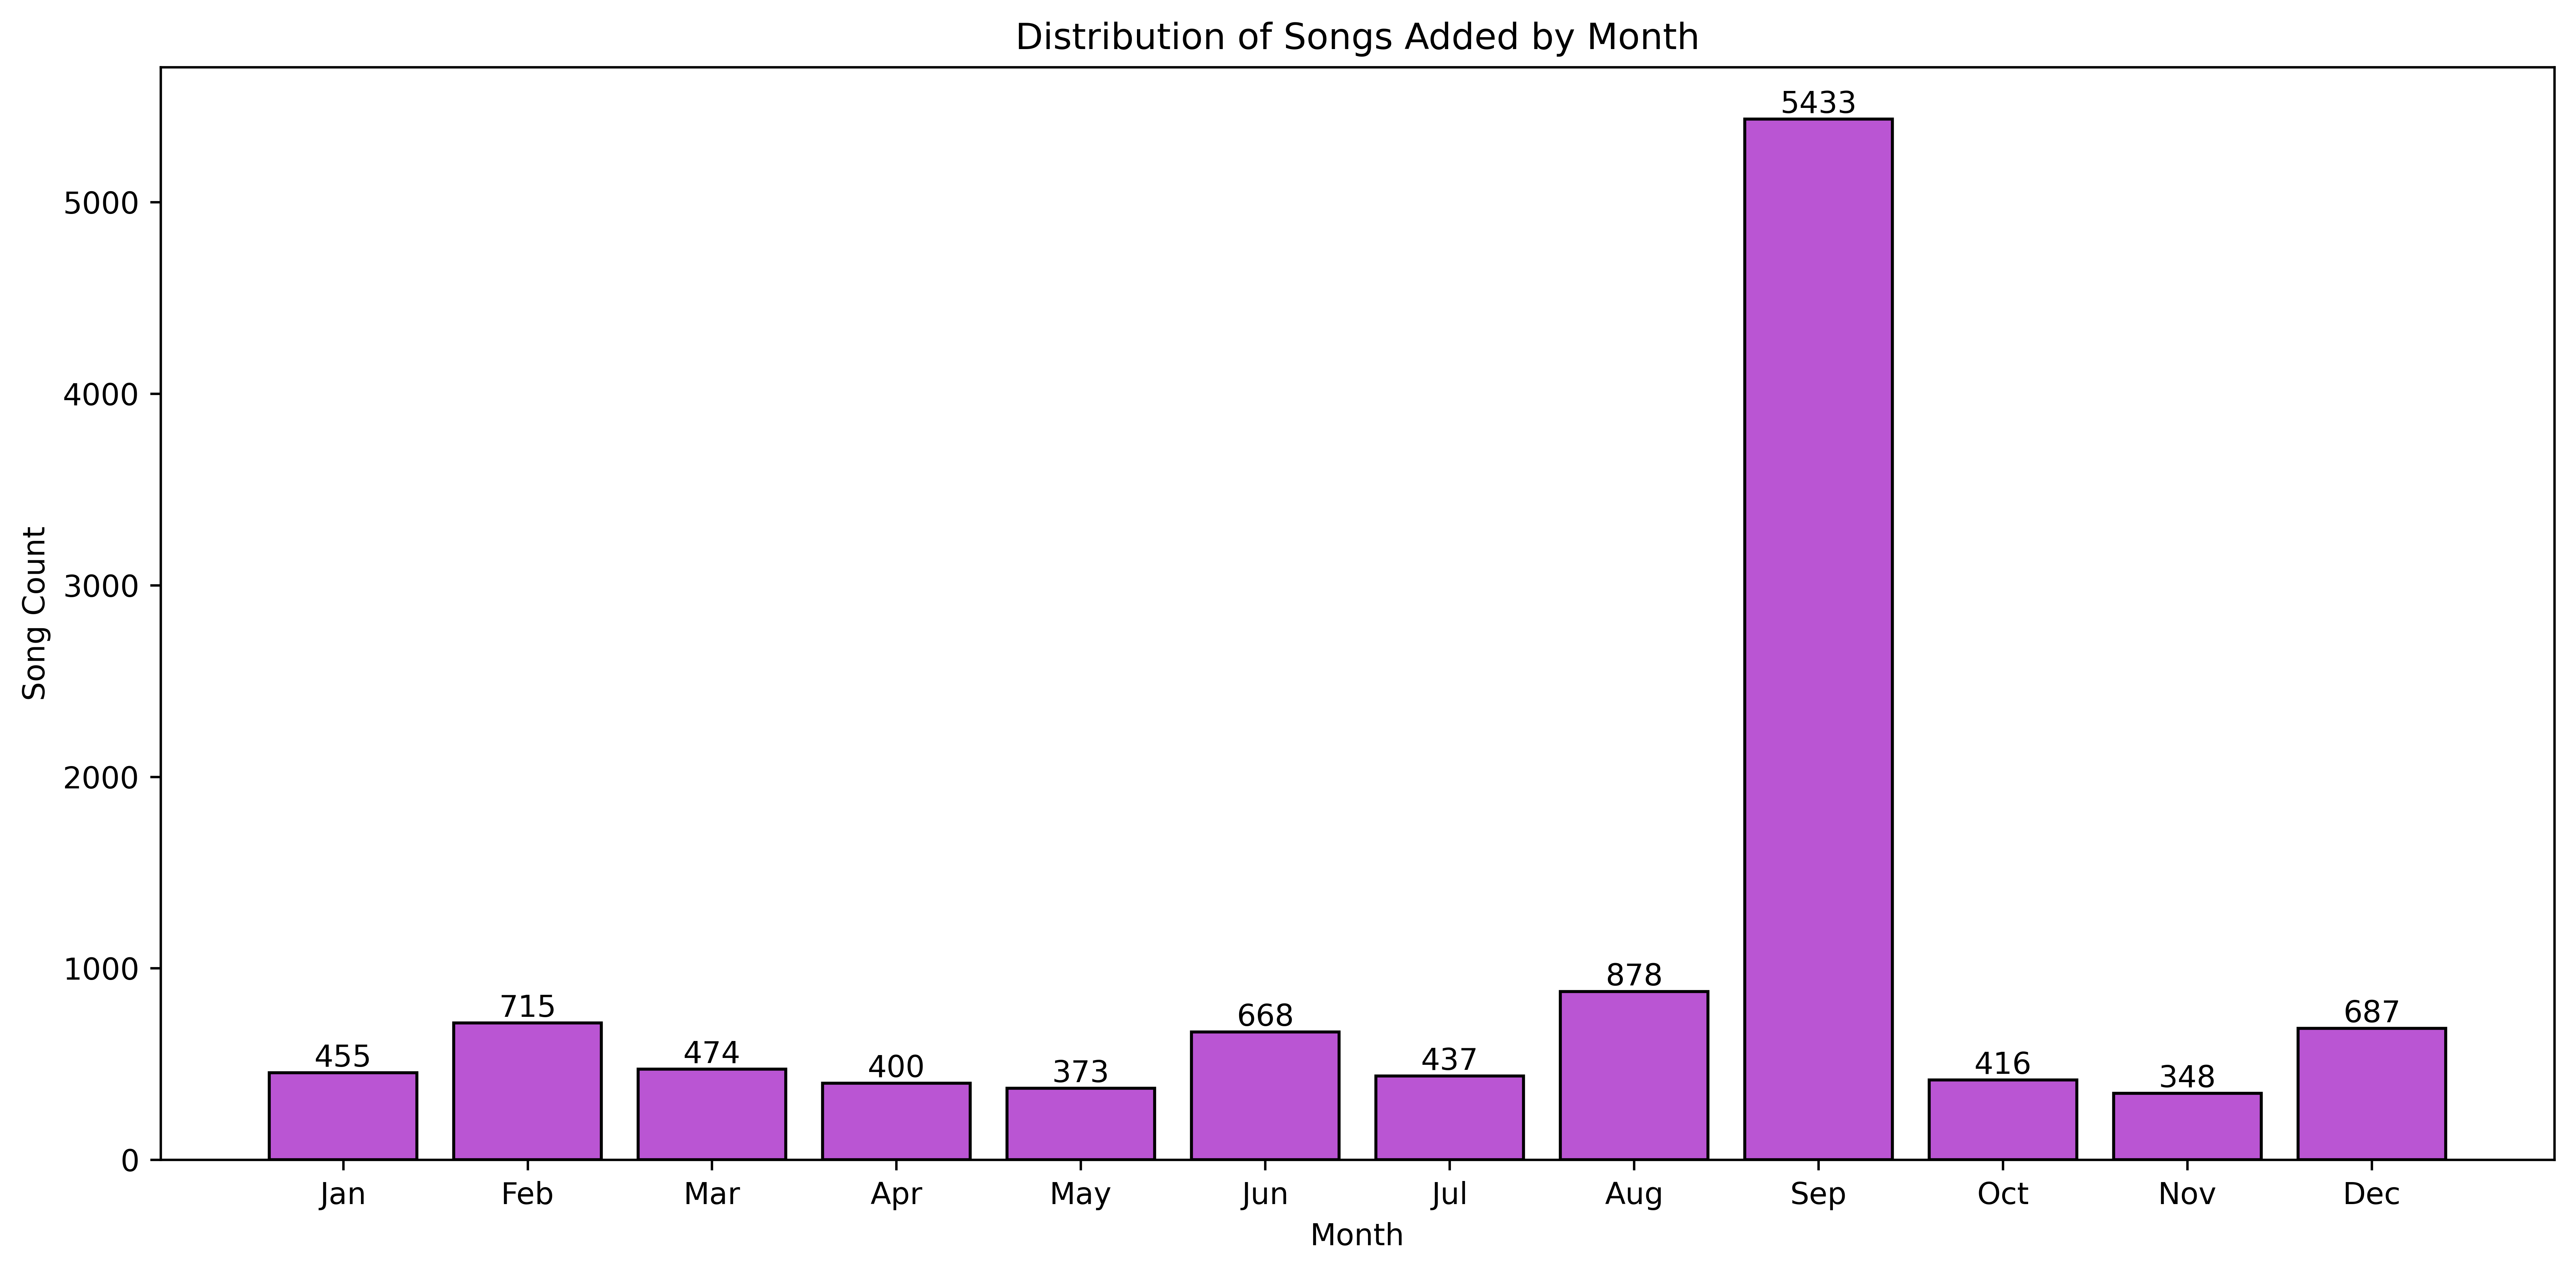
Looks like Feb, Jun, Aug, and Dec are when I am searching for and adding most of my music.
Spotify outputs a range of musical properties such as tempo, danceability, and valence. I think they are more of an estimate than an exact science, so this section should be taken with a pinch of salt. Regardless, let's take a look to scope out the overall mood and feel of my library.
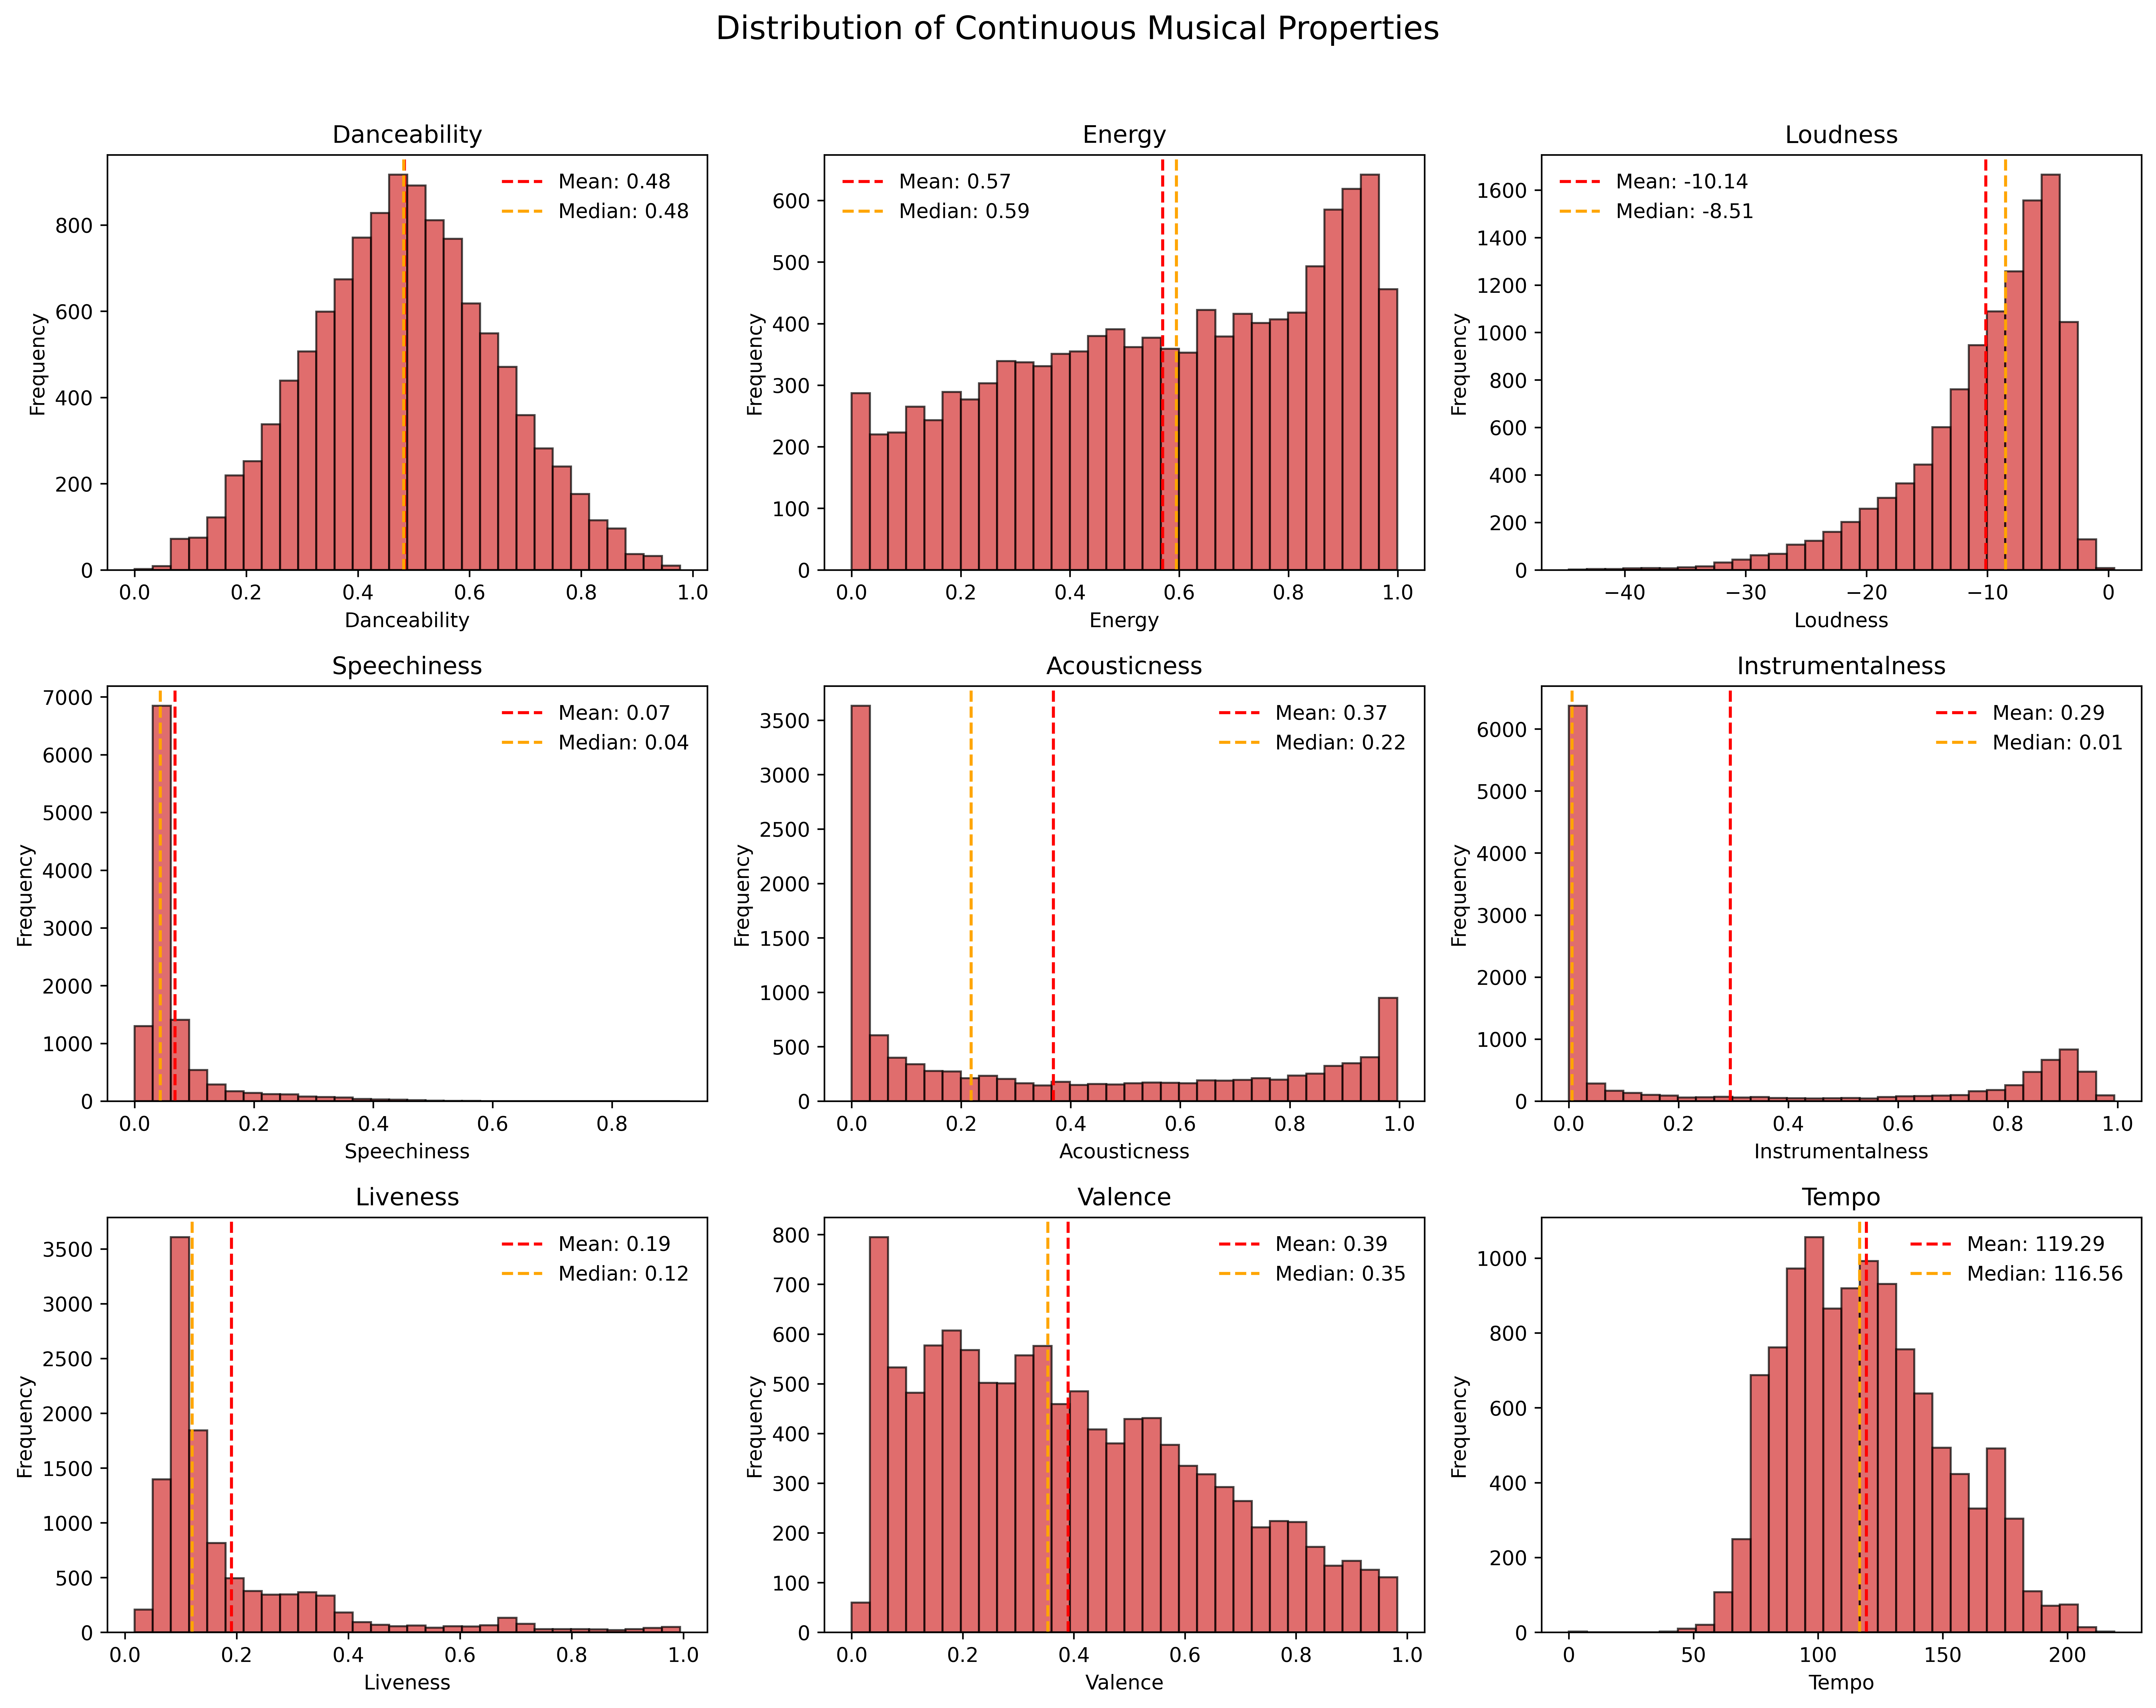
Valence stands out to me, since I always seem to prefer songs in a minor key, and not "happy" songs.
Rock and metal tend to be more angsty and like this, which adds up here. Tempo is also interesting, since
musicians tend to prefer a tempo of 120 bpm (it's commonly said that this is best tempo for a "hit" song)
and we can see that in the data here. It's negatively skewed suggesting I slightly prefer slower songs which
seems true as well.
Let's look at the categorical variables Mode, Key, and Time Signature — comparing them against
my "Current Favorites" playlist below again:


My theory about preferring minor keys is again confirmed here. C, D, Db, E, F, G, and A are all popular keys, while Eb and Gb are rarely used which is funny since Ebm is one of my favorite keys to play in.
This was a fun project which revealed some interesting facts about my musical tastes. I'd be interested to do some deeper analysis and perhaps compare my data against someone else's — for example, it'd be cool to see a plot showing how much your musical tastes overlap with someone (like a "Music Compatibility Score") or see which of your top 50 artists do they also listen to. Let me know if you have any ideas, and thanks for reading!
For those interested, here's a preview of my "Current Favourites" playlist.
Click the title to hear the full thing on Spotify.